
Shopify gross vs net profit: what the gap is telling you
Most Shopify store owners celebrate when revenue climbs. Some keep an eye on gross profit too. But the number that actually tells you whether your business is healthy — net profit — often gets ignored until something goes wrong.
If you've ever looked at your Shopify dashboard and felt a quiet sense of unease about where the money actually goes, you're not imagining things. Shopify gross vs net profit isn't just a terminology question. The gap between those two numbers is one of the most revealing metrics in your entire business — and most store owners never look at it directly.
This article walks you through what both numbers mean, why the gap exists, what it's trying to tell you, and how to use it to make better decisions.
What is gross profit vs net profit?
Gross profit is your revenue minus the cost of goods sold (COGS) — what you paid to actually produce or purchase the products you sold. If you sold $10,000 worth of products and the inventory cost you $4,000, your gross profit is $6,000.
Net profit is what's left after everything else comes out: Shopify fees, transaction fees, shipping costs, ad spend, returns, app subscriptions, and any other operating expenses.
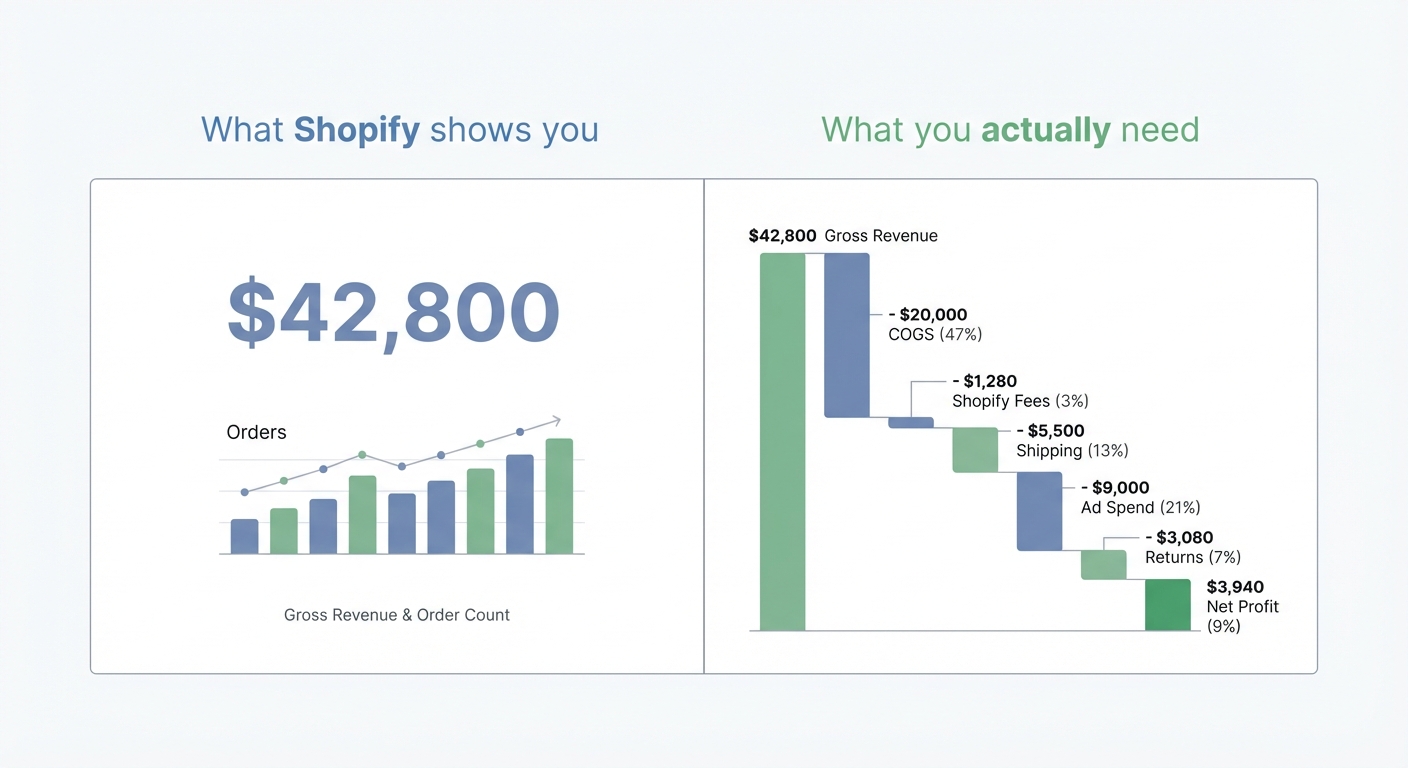
Same $10,000 in revenue. After fees, ads, shipping, and returns? You might be looking at $900 in actual net profit — or less.
Why Shopify only shows you part of the picture
Shopify's built-in analytics are genuinely useful for tracking orders, sessions, and conversion rates. But they weren't designed to show you real profit.
Here's what Shopify's dashboard does well:
- Total sales and revenue trends
- Units sold by product
- Average order value
- Traffic sources
Here's what it doesn't tell you:
- Your COGS against each order
- Shopify and payment processing fees per transaction
- Actual shipping cost vs what you charged the customer
- How returns affected your real margins
- Whether your ads paid for themselves
You can see gross sales easily. Net profit? That requires pulling together data from at least four or five different places — your product costs, Shopify's fee reports, your shipping carrier, your ad platforms. Most merchants never do this calculation, not because they don't care, but because it's genuinely tedious.
The real cost of selling on Shopify
Before we can talk about the gap between gross and net, you need a clear picture of what's eating into your margins. Let's run through the main culprits.
Shopify subscription and transaction fees
If you're on the Basic plan ($39/month), you're paying 2.9% + 30¢ on every Shopify Payments transaction. On the Shopify plan ($105/month), that drops to 2.6% + 30¢. On Advanced ($399/month), it's 2.4% + 30¢.
If you use a third-party payment processor instead of Shopify Payments, add an extra 0.5%–2% on top of that. These numbers are documented by Shopify directly, but easy to underestimate when you're looking at a busy month.
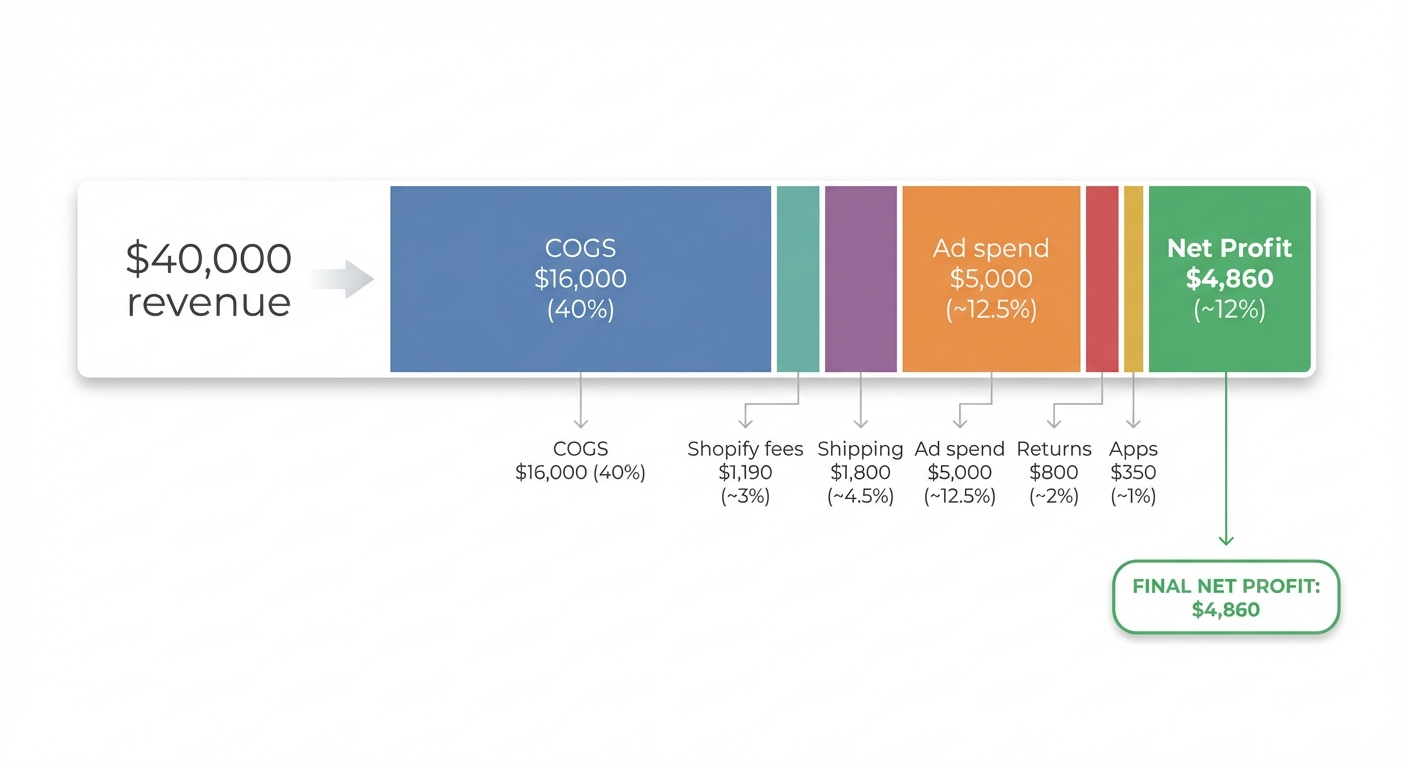
On $40,000 in sales with Shopify Payments Basic, you're paying roughly $1,190 in processing fees alone — before you've touched COGS, shipping, or ads.
Shipping costs
Free shipping has become a customer expectation, but somebody's paying for it. If you're absorbing shipping on orders to keep conversion rates up, that cost is coming directly out of your margin.
A store shipping 300 orders a month at $6 average shipping cost is spending $1,800 monthly on shipping. If those products have a 40% gross margin, $1,800 in shipping costs wipes out the gross profit from roughly 75 orders. That's not a rounding error — that's a real business decision.
Advertising spend
This is usually the biggest wild card. A store spending $5,000/month on Meta ads with a reported 3x ROAS looks great on paper. But ROAS is calculated on revenue, not profit. If those sales have a 40% gross margin, that 3x ROAS is actually closer to a 1.2x return on your cost — barely breaking even after you factor in COGS.
We wrote a full breakdown of this in our piece on ROAS vs profit — it's worth reading if ads are a meaningful part of your spend.
Returns and chargebacks
Returns are often treated as an accounting line item rather than a real cost. But when a customer returns a product, you typically eat the return shipping, Shopify doesn't always refund the original transaction fee, and restocking takes time. For some stores — apparel especially — return rates of 15%–25% can dramatically compress net margins.
App subscriptions
This one sneaks up on people. The average Shopify store runs six to ten apps. At $20–$50/month each, you could easily be spending $300–$400/month on tools. That's $4,800/year — meaningful at smaller revenue scales.
Want to see your real numbers?
Try our free profit calculator — plug in your numbers and see your real net margin in 30 seconds.
Try the free calculator →How to calculate your net margin
The formula itself is straightforward:
Net margin = (Net profit ÷ Revenue) × 100
And net profit = Revenue − COGS − all operating expenses (fees, shipping, ads, returns, apps, etc.)
Let's run a real example:
| Item | Amount |
|---|---|
| Revenue | $40,000 |
| COGS | −$16,000 |
| Gross profit | $24,000 |
| Shopify fees | −$1,190 |
| Shipping costs | −$1,800 |
| Ad spend | −$5,000 |
| Returns | −$800 |
| App subscriptions | −$350 |
| Net profit | $4,860 |
| Net margin | 12.2% |
That 60% gross margin? It becomes 12.2% net. That's not bad — but it's a very different story than what the top-line numbers suggest.
You can plug in your own numbers with our free profit calculator to see where you actually land.
What the gap is actually telling you
Here's the thing about the gross-to-net gap: it's not just a math problem. It's a diagnostic tool.
A wide gap between gross and net profit tells you one of a few things:
Your ad spend is high relative to margin. If you have a 50% gross margin but only 8% net margin, and your COGS are fixed, the gap is almost certainly coming from customer acquisition costs. That's a signal to look hard at which channels are actually profitable — not which ones have the best-looking ROAS.
Your shipping strategy is costing you more than you think. Stores that offer free shipping across the board without adjusting product prices are essentially subsidizing customer decisions with their own profit. The fix isn't always to charge for shipping — sometimes it's raising prices, setting free shipping thresholds, or negotiating better carrier rates.
Returns are compressing margins on specific products. Most store owners look at returns as a store-wide number. But returns are often concentrated in two or three products. If you can identify which SKUs have the worst return rates, you can address those specifically — better product photography, sizing guides, product descriptions that set accurate expectations.
You're carrying too much overhead in apps and tools. If your net margin is thin, a $50/month app that you barely use isn't a minor expense — it's a decision. Audit your app stack every quarter.
When the gap is healthy vs when it's a warning sign
A gross-to-net gap of 20–30 percentage points is fairly typical for a well-run Shopify store with meaningful ad spend. A gap of 40+ points is worth investigating. It doesn't mean the business is failing — it means something specific is consuming margin, and you should know what it is.
The gross margin number tells you whether your product economics work. The net margin tells you whether your business model works.
Both matter. Neither one alone is enough.
Why tracking this over time matters more than a single snapshot
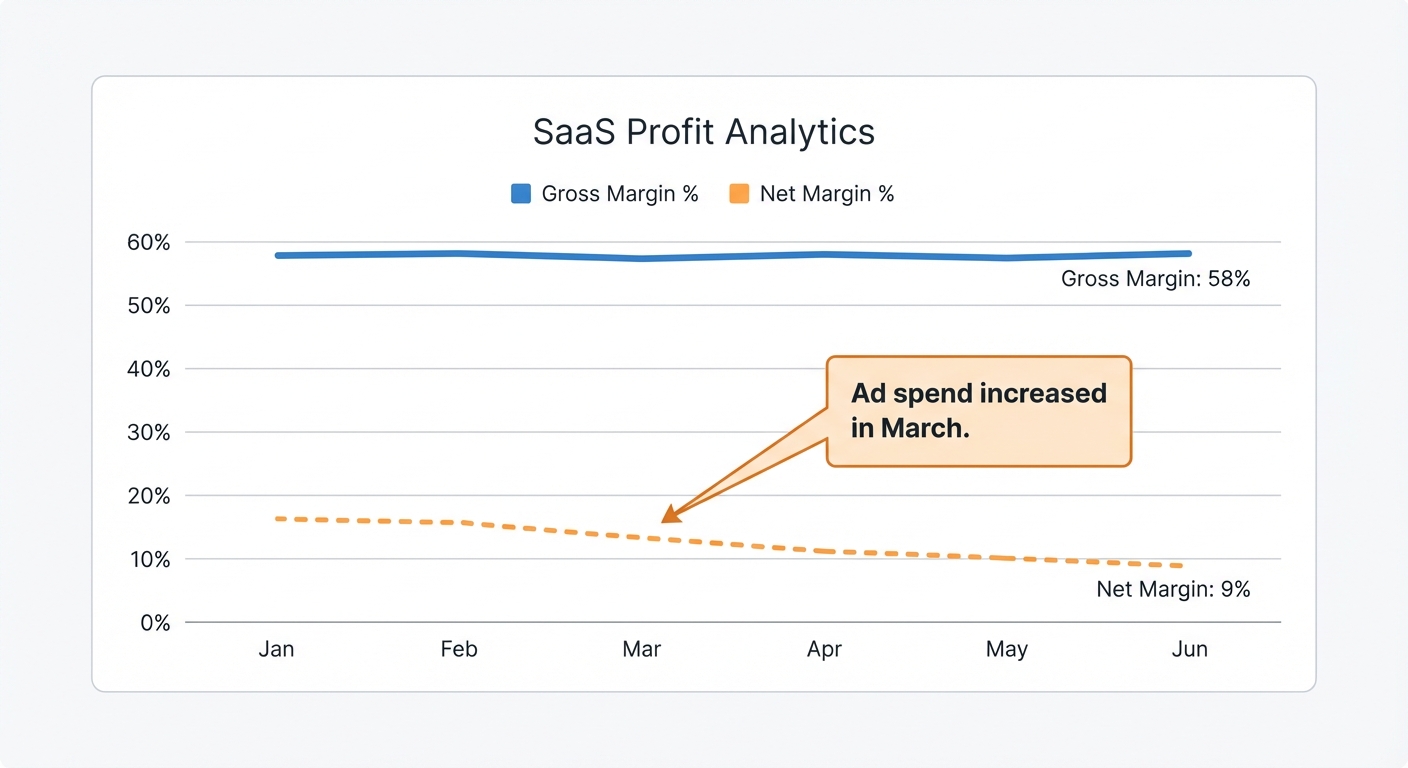
A store with a 12% net margin this month might have had 18% last month. What changed? If you're not tracking this consistently, you won't know — and you won't catch a problem until it's already significant.
A few scenarios where the trend matters more than the number:
- Ad costs rising, prices unchanged. Meta and Google CPMs fluctuate. If your acquisition cost per order goes from $8 to $14 and your product price stays the same, your net margin is declining even if revenue is growing.
- New product launches with different margins. Adding a lower-margin product to your catalog can dilute your overall net margin without being immediately obvious.
- Shipping carrier rate increases. Carriers adjust rates. If you're not tracking shipping cost as a percentage of revenue, a rate change can quietly erode margins over months.
This is why looking at Shopify gross vs net profit as a trend — not just a monthly report — is one of the most useful habits you can build.
Gross profit by product vs net profit by product
Here's where things get really useful — and where most Shopify reporting falls completely short.
Store-wide margins are helpful context. But product-level margins are where you actually make decisions.
Say you sell three products:
- Product A: $80 price, $22 COGS, ships for $5, rarely returned → strong net margin
- Product B: $60 price, $28 COGS, ships for $8, 20% return rate → weak net margin despite decent gross margin
- Product C: $45 price, $9 COGS, minimal shipping → excellent net margin
If you're spending your ad budget equally across all three, you're subsidizing Product B with profits from A and C. That's a common situation. You can only see it when you're looking at net profit per product — not just revenue or even gross profit.
Most store owners have one or two products that are quietly dragging down overall profitability. Finding them isn't complicated once you have the right data. Acting on it is even simpler: shift ad spend, adjust pricing, or discontinue.
Getting to real profit visibility
Calculating Shopify gross vs net profit accurately means connecting several data sources that don't naturally talk to each other: your Shopify order data, your COGS, your shipping carrier invoices, your ad platform spend, and your payment processor fees.
Doing this manually in a spreadsheet is possible. We've seen it. It takes hours, it's error-prone, and it only gives you a backward-looking snapshot. Most store owners do it once, feel good about it, and then don't revisit it for three months.
The better approach is to have your profit dashboard update automatically — so you can see where your net margin stands today, which products are most profitable, and whether this week's ad spend is actually working.
That's exactly what Shopimize is built for. Connect your store, add your COGS and ad accounts, and you get a live view of your true profit — down to the product and order level, without building a single spreadsheet.
The bottom line on gross vs net profit
Gross profit tells you whether your product pricing and sourcing make sense. Net profit tells you whether your whole business makes sense. You need both — but most Shopify merchants are making decisions with only one of them.
The gap between your gross and net profit isn't something to be anxious about. It's information. A wide gap might mean your ad strategy needs recalibrating. A shrinking gap over time is a clear sign something changed. Knowing which products actually make you money — at the net level — changes where you focus.
Tracking Shopify gross vs net profit consistently is one of the highest-leverage habits in your business. The stores that do it make better pricing decisions, spend their ad budgets more efficiently, and don't get surprised by bad months.
FAQ
What's the difference between gross profit and net profit on Shopify?
Gross profit is your revenue minus the cost of goods sold — what you paid for the products you sold. Net profit is what remains after all other expenses are deducted: Shopify fees, transaction fees, shipping, ad spend, returns, and app costs. Shopify's built-in dashboard shows you gross sales figures but doesn't calculate true net profit automatically.
What is a good net margin for a Shopify store?
Net margins vary significantly by niche, but 10%–20% is a reasonable benchmark for a healthy, scaled Shopify store with meaningful ad spend. Stores with lower acquisition costs (strong organic traffic or email) can achieve 25%+. Below 5% is a signal worth investigating, especially if you're growing — scaling a low-margin business often makes the problem worse, not better.
How do I calculate my real net profit from Shopify?
Start with your total revenue, subtract COGS, then subtract Shopify subscription and transaction fees, shipping costs (what you paid, not what you charged), ad spend across all platforms, return costs, and app subscriptions. The result is your net profit; divide by revenue and multiply by 100 to get your net margin percentage. Our free profit calculator can walk you through this with your own numbers.
Why does my gross margin look good but net margin feel low?
Usually it's one of three things: ad spend that's high relative to your margin, shipping costs you're absorbing to offer free shipping, or a high return rate on specific products. The gross-to-net gap is a useful diagnostic — a 40+ percentage point difference almost always points to a specific cost driver worth addressing.