
Why a 4x ROAS doesn't mean you're profitable
A 4x ROAS. Four dollars back for every dollar spent. That's the kind of number that looks great in your Meta Ads dashboard. It's the kind of number you'd screenshot for your team Slack.
But here's the thing: ROAS tells you how much revenue your ads generated. It says nothing about whether you made any money.
A store with a 4x ROAS, thin margins, and high shipping costs can lose money on every ad-driven order. A store with a 2.5x ROAS but great margins and low costs can be deeply profitable. The ROAS number alone can't tell you which one you are.
This is one of the most expensive misunderstandings in e-commerce advertising. Let's break it down with actual math.
What ROAS actually measures (and what it doesn't)
ROAS = Revenue ÷ Ad Spend
That's it. If you spent $1,000 on Facebook Ads and those ads generated $4,000 in revenue, your ROAS is 4.0.
What ROAS does not account for:
- Cost of goods sold (COGS)
- Shipping and fulfillment costs
- Payment processing fees
- Shopify subscription and app costs
- Returns and refunds
- Any other operating expense
ROAS treats revenue as though it's all profit. But revenue and profit are very different numbers. On a $50 order, your actual take-home after all costs might be $12. ROAS has no idea.
This means ROAS is a measure of ad efficiency — how effectively your ads convert spending into revenue. It is not a measure of profitability — whether the resulting orders make you money.
The math that exposes the problem
Let's use a real scenario. You run a skincare brand on Shopify with a $55 average order value.
Your cost structure per order
| Cost component | Amount |
|---|---|
| COGS (product cost) | $9.50 |
| Outbound shipping | $5.80 |
| Packaging | $1.10 |
| Payment processing (2.9% + $0.30) | $1.90 |
| Share of Shopify + apps ($430/mo ÷ 600 orders) | $0.72 |
| Total non-ad costs | $19.02 |
That leaves $35.98 per order before ad spend. This is your profit before advertising — the maximum you can afford to spend on acquisition per order and still break even.
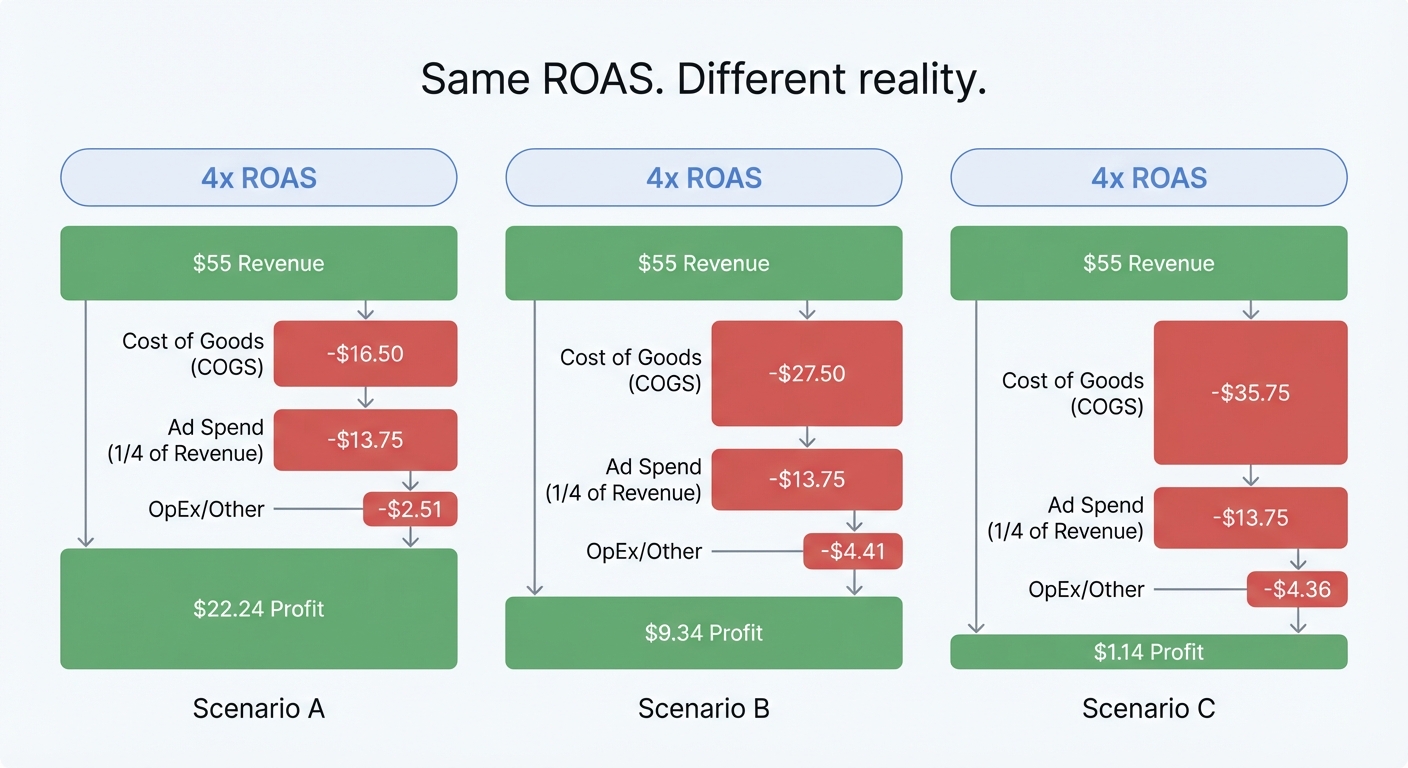
Scenario A: 4x ROAS
You spent $5,000 on Meta Ads and generated $20,000 in revenue (364 orders at $55 AOV).
- Cost per acquisition (CPA): $5,000 ÷ 364 = $13.74
- Profit per order: $35.98 - $13.74 = $22.24
- Total profit: 364 × $22.24 = $8,095
- Net margin: 40.5%
That's profitable. The 4x ROAS works here because your margins are healthy.
Scenario B: 4x ROAS (different store)
Now imagine a different store — electronics accessories, $55 AOV, but with higher costs.
| Cost component | Amount |
|---|---|
| COGS (product cost) | $22.00 |
| Outbound shipping | $6.50 |
| Packaging | $0.80 |
| Payment processing | $1.90 |
| Share of Shopify + apps | $0.72 |
| Total non-ad costs | $31.92 |
Profit before advertising: $55 - $31.92 = $23.08
Same 4x ROAS. $5,000 ad spend, $20,000 revenue, 364 orders.
- CPA: $13.74
- Profit per order: $23.08 - $13.74 = $9.34
- Total profit: 364 × $9.34 = $3,400
- Net margin: 17%
Still profitable, but dramatically less so. Same ROAS — completely different profitability.
Scenario C: 4x ROAS (and you're losing money)
Now imagine a home goods store. $55 AOV, heavy products, free shipping offer.
| Cost component | Amount |
|---|---|
| COGS (product cost) | $18.00 |
| Outbound shipping (heavy item, free shipping) | $12.50 |
| Packaging | $2.20 |
| Payment processing | $1.90 |
| Share of Shopify + apps | $0.72 |
| Returns (15% return rate, allocated) | $4.80 |
| Total non-ad costs | $40.12 |
Profit before advertising: $55 - $40.12 = $14.88
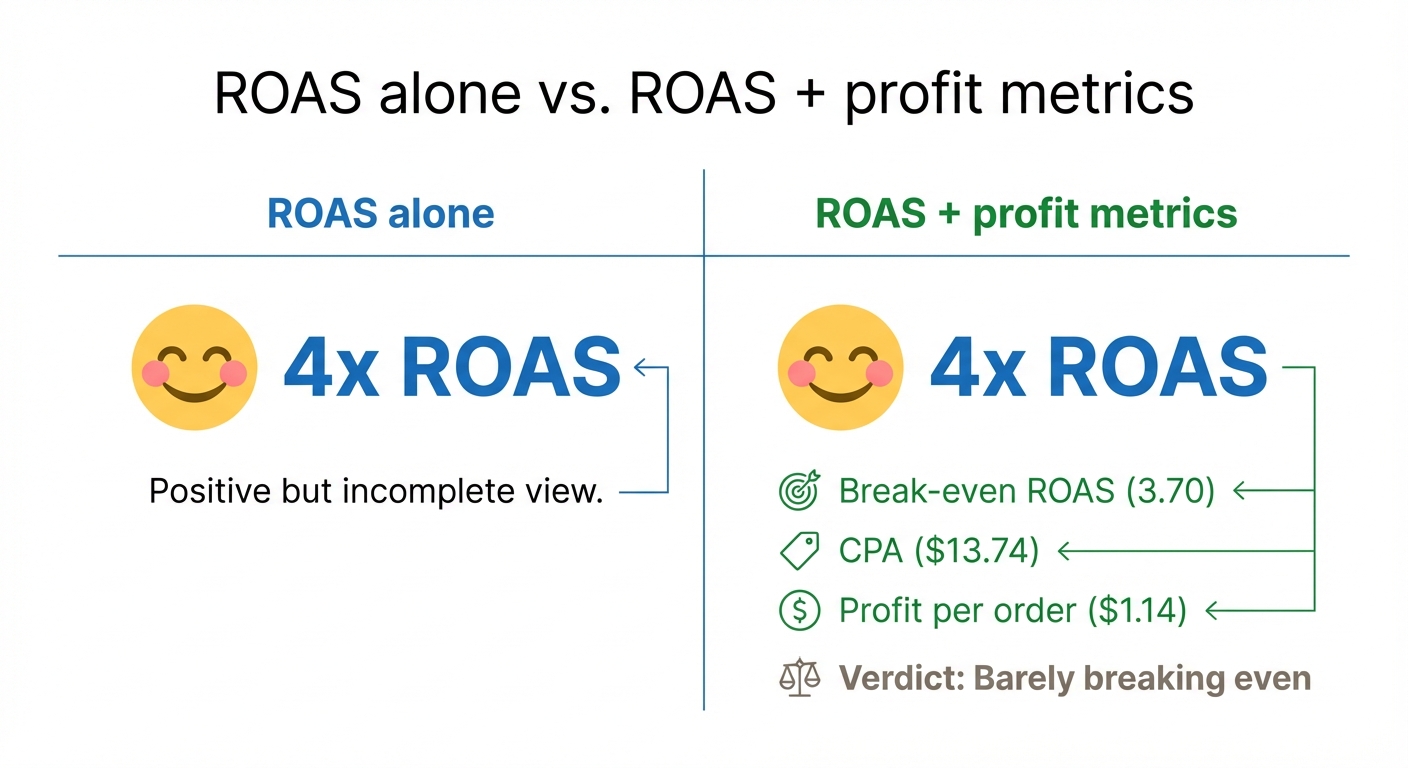
Same 4x ROAS. Same CPA of $13.74.
- Profit per order: $14.88 - $13.74 = $1.14
- Total profit: 364 × $1.14 = $415
- Net margin: 2.1%
You're making $415 on $20,000 in revenue. That's not a business — it's a rounding error. And if your CPA creeps up by even $2 (which it does all the time), you're losing money on every order.
Same ROAS. Three completely different outcomes.
How to calculate your break-even ROAS
Your break-even ROAS is the minimum ROAS at which your ads stop losing money. Below it, every ad-driven order costs you more than it makes. Above it, you're profitable.
The formula is straightforward:
Break-Even ROAS = 1 ÷ (1 - Cost Ratio)
Where Cost Ratio = Non-Ad Costs ÷ Revenue
Or more intuitively:
Break-Even ROAS = Revenue ÷ Profit Before Ads (per order)
Worked example
Using our skincare brand from Scenario A:
- Revenue per order: $55
- Non-ad costs per order: $19.02
- Profit before ads: $35.98
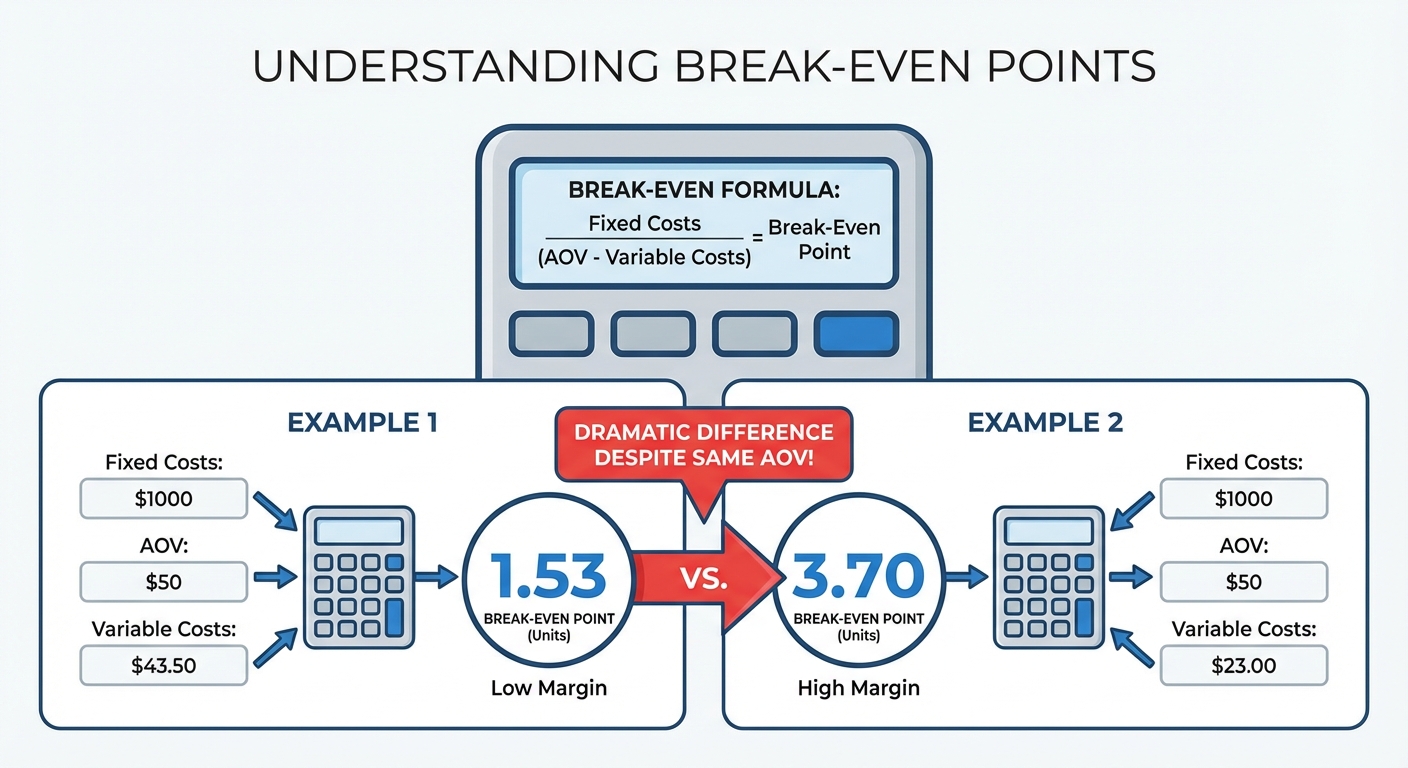
Break-Even ROAS = $55 ÷ $35.98 = 1.53
Any ROAS above 1.53 is profitable. A 4x ROAS gives you plenty of room.
Now the home goods store from Scenario C:
- Revenue per order: $55
- Non-ad costs per order: $40.12
- Profit before ads: $14.88
Break-Even ROAS = $55 ÷ $14.88 = 3.70
This store needs almost a 4x ROAS just to break even. A 3.5x ROAS — which many marketers would consider solid — actually loses money here.
That's the key insight: your break-even ROAS is determined by your cost structure, not by any universal standard. A store with tight margins might need a 5x ROAS to survive. A store with great margins might be profitable at 1.5x.
Track this automatically
Shopimize shows your real profit per order, per product, per channel.
Try Shopimize free →Why ROAS gets worse over time
Even if your current ROAS is profitable, there's a structural problem with relying on ROAS as your north star metric: it tends to decline as you scale.
Audience saturation. Your best-performing audience segments get shown your ads first. As you increase budget, the algorithm reaches colder, less interested audiences. CPA goes up, ROAS goes down.
Rising CPMs. Meta and Google ad costs have increased by 15-30% year-over-year in most e-commerce categories. The same ROAS target requires more efficient creative and better targeting each year just to stay flat.
Attribution gaps. Post-iOS 14, platform-reported conversions are estimated, not measured. Your Meta dashboard might show a 4x ROAS that's actually a 3x in reality because some conversions are modeled, not tracked. You could be making decisions on inflated numbers.
Diminishing returns at scale. Going from $5,000/month to $10,000/month in ad spend rarely doubles your revenue. You might go from a 4x to a 3.2x ROAS — which, depending on your margins, could be the difference between profit and loss.
This is why merchants who only watch ROAS get caught off guard. The number that was "great" at $5K/month becomes unsustainable at $15K/month, and they don't notice until they check their bank account.
What to track instead of ROAS
ROAS isn't useless — it's just incomplete. Here's what to pair it with to get the full picture.
Profit After Ad Spend (POAS)
POAS = (Profit per order - CPA) × Orders
This is the metric that actually answers "are my ads making me money?" It takes your real profit per order (after all non-ad costs) and subtracts the cost of acquiring that customer.
If POAS is positive, your ads are profitable. If it's negative, you're paying money to lose money.
Break-Even CPA
Break-Even CPA = Revenue per order - All non-ad costs per order
This is the maximum you can spend to acquire one customer before you start losing money. Set this as a hard cap in your ad platforms. It turns a fuzzy "let's aim for 4x ROAS" into a concrete "don't spend more than $14.88 to acquire an order."
Blended CPA (including organic)
Blended CPA = Total ad spend ÷ Total orders (paid + organic)
This accounts for the fact that not every order comes from ads. If you're spending $5,000/month on ads and getting 600 total orders (half from ads, half organic), your blended CPA is $8.33 — much lower than the $13.74 per paid-only order. This is the number that should go into your cost-per-order calculations.
Contribution margin per channel
Not all channels are equally profitable. Your Google Shopping ads might have a 3x ROAS but high intent (low returns), while your TikTok campaigns might hit 5x ROAS but with 20% return rates that wipe out the margin.
Tracking profit after ad spend per channel — not just ROAS per channel — tells you where to allocate budget.
How to set profitable ROAS targets
Now that you know your break-even ROAS, here's how to set targets that ensure profitability — not just ad efficiency.
Step 1: Calculate your break-even ROAS per product (or product category). Different products have different cost structures. Your t-shirts and your heavy blanket have very different break-even points.
Step 2: Add your profit target. Break-even means $0 profit. If you want a 15% net margin on ad-driven orders, your target ROAS needs to be higher than break-even. The formula:
Target ROAS = Revenue ÷ (Profit Before Ads - Target Profit per Order)
Example: Skincare brand, $55 AOV, $35.98 profit before ads, target net profit of $8.25 per order (15% margin).
Target ROAS = $55 ÷ ($35.98 - $8.25) = $55 ÷ $27.73 = 1.98
A 2x ROAS hits your 15% profit target for this product. There's no need to chase 4x — that's vanity.
Step 3: Set channel-specific targets. Your break-even ROAS is the same across channels, but your target ROAS should factor in channel-specific return rates and conversion quality. If TikTok has a 18% return rate vs 8% on Google Shopping, TikTok's effective costs are higher and it needs a higher ROAS to deliver the same profit.
Step 4: Review monthly. Costs shift. COGS changes, shipping rates adjust, processing fees evolve. Recalculate your break-even quarterly to make sure your targets still make sense.
The real-world trap: scaling into losses
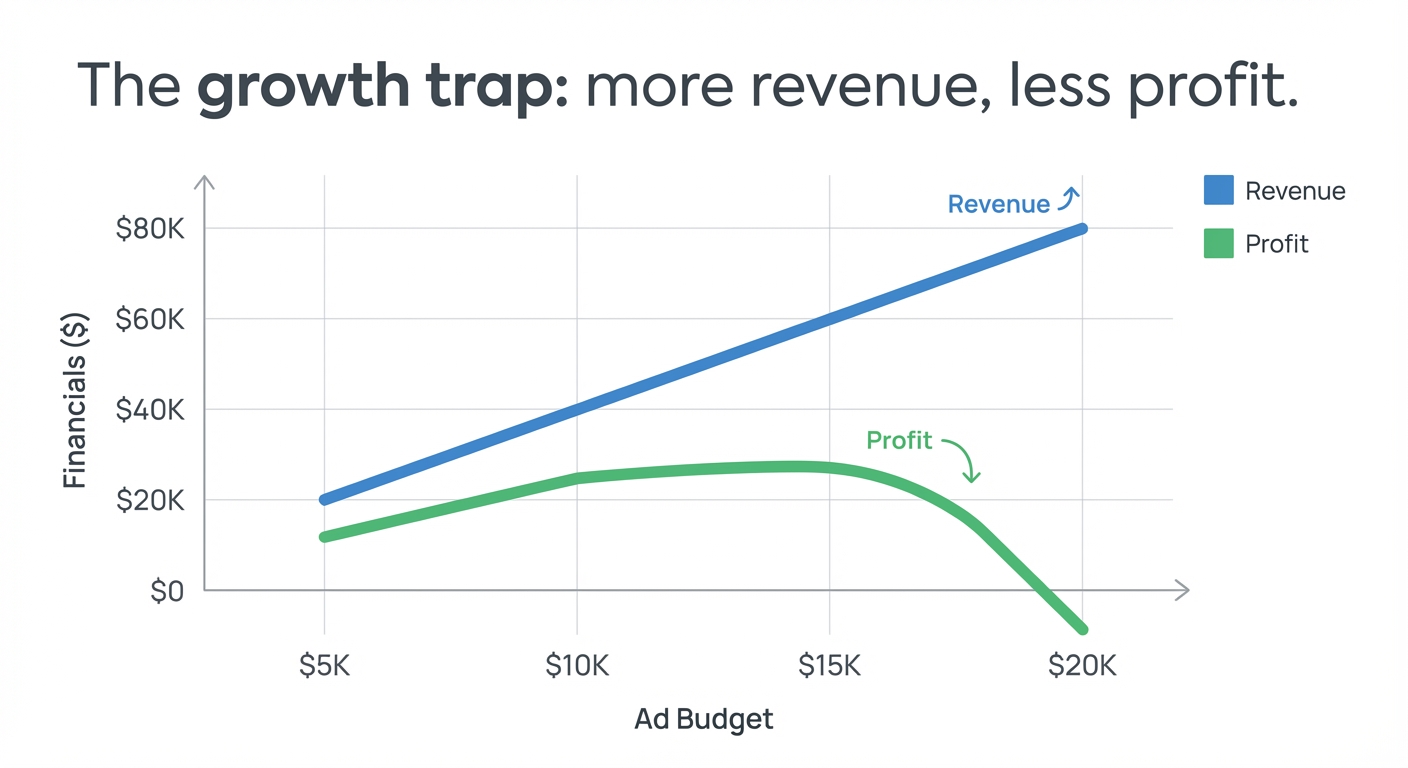
Here's a scenario we see constantly. A store is running Meta Ads at a 4.5x ROAS and decides to scale. They increase budget from $5,000 to $15,000 per month.
What happens:
- ROAS drops to 3.2x (normal at higher budgets)
- Revenue triples from $20,000 to $48,000
- The owner celebrates the growth
What they don't notice:
- Their break-even ROAS was 3.0x
- At 3.2x, they're making $0.80 profit per order
- At 3.0x, they'd be at exactly zero
- If ROAS dips to 2.8x (a normal fluctuation), they're losing money on every order
- They've tripled their revenue and their losses simultaneously
This is the "growth trap." Revenue goes up, the ad dashboard looks green, but profit goes sideways or negative. The only way to catch it is to track profit, not just ROAS.
Frequently asked questions
What's a good ROAS for Shopify stores?
There's no universal answer because "good" depends entirely on your cost structure. A store with 75% gross margins can be profitable at a 1.5x ROAS. A store with 40% gross margins might need 4x+ to break even. Calculate your break-even ROAS first — then anything above it is "good."
Is a 2x ROAS bad?
Not necessarily. For stores with high margins and low operational costs, a 2x ROAS can be very profitable. For stores with thin margins, it might mean losses. The number is meaningless without context about your cost structure.
How do I calculate break-even ROAS?
Break-Even ROAS = Revenue per order ÷ (Revenue per order - Non-ad costs per order). You need to know your complete cost structure: COGS, shipping, processing fees, and allocated monthly expenses. We walk through the full formula and examples above.
Should I optimize for ROAS or profit?
Profit — always. ROAS is a useful signal for ad platform performance, but your goal is to make money, not to hit a ROAS number. Set ROAS targets based on your break-even calculation, not on industry averages or what someone said in a Facebook group.
Does this apply to Google Ads too?
Yes. The same math applies to every paid channel — Google Ads, Meta Ads, TikTok Ads, Pinterest Ads, and any other platform. The only difference is that each channel may have different return rates and conversion quality, which affects the effective cost per profitable order.
Track profit, not just ROAS
ROAS is a useful metric. It's just not the right metric for answering "am I making money?" It tells you how efficiently your ads are generating revenue — but revenue isn't profit.
The stores that scale successfully are the ones that know their break-even ROAS by product, track profit after ad spend per channel, and set concrete CPA limits based on actual margins. They don't chase a ROAS number they saw in a blog post. They chase a profit number they calculated from their own data.
Want to see your real profit per ad dollar — automatically, across all channels? Try Shopimize free and connect your ad accounts in under two minutes.