
Shopify profit margin benchmarks by niche (2026)
"Am I making enough?" It's the question every Shopify store owner asks — and the hardest one to answer, because "enough" depends entirely on your niche, your business model, and which margin you're looking at.
A 25% gross margin in beauty might mean you're in trouble. A 25% gross margin in electronics might mean you're outperforming your peers. Without context, margin numbers are meaningless.
This guide gives you that context. We've compiled profit margin benchmarks across the most common Shopify niches, covering both gross margin and net margin — because the gap between those two numbers is where most of the confusion (and most of the opportunity) lives.
Gross margin vs net margin: a quick refresher
Before we get into the numbers, let's be precise about what we're measuring.
Gross margin = (Revenue - COGS) ÷ Revenue
This tells you what percentage of revenue is left after subtracting only the product cost. It's the number Shopify can show you (if you've entered cost per item). It looks good on paper but doesn't tell the full story.
Net margin = (Revenue - All Costs) ÷ Revenue
This tells you what percentage of revenue you actually keep after everything — COGS, shipping, processing fees, ad spend, app subscriptions, Shopify plan, and all other expenses. It's the number that actually matters.
A store can have a gorgeous 70% gross margin and a painful 5% net margin. The gap between those two numbers is eaten by ads, shipping, and fees. Understanding both is essential for benchmarking.
The benchmarks: gross and net margin by niche
These ranges are based on aggregated data from e-commerce industry reports, Shopify merchant surveys, and our own analysis at Shopimize. They represent healthy, sustainable ranges — not best-in-class outliers.
| Niche | Gross Margin Range | Typical Net Margin | Notes |
|---|---|---|---|
| Beauty & skincare | 65-80% | 15-28% | High gross margins thanks to low COGS. Ad spend is the main margin killer — CAC in beauty is high and rising. Brands with strong organic/community traffic do significantly better. |
| Health & supplements | 60-78% | 12-25% | Similar dynamics to beauty. Regulatory costs (testing, compliance, labeling) add overhead that doesn't show in COGS. Subscription models improve net margins by reducing CAC over time. |
| Apparel & fashion | 50-65% | 8-18% | Return rates of 15-30% crush net margins. Size exchanges and seasonal markdowns are constant. Direct-to-consumer brands with loyal followings sit at the high end. |
| Jewelry & accessories | 60-80% | 15-30% | Handmade jewelry has the highest margins. Fashion jewelry has higher volume but lower margins. Packaging and presentation costs are real but often overlooked. |
| Home & garden | 45-60% | 10-20% | Shipping costs are a major factor — heavy, bulky items eat into margins. Free shipping offers can be devastating if not priced in. |
| Food & beverage | 45-60% | 8-15% | Perishability, cold chain logistics, and strict packaging requirements add hidden costs. Subscription boxes improve predictability and net margins. |
| Electronics & gadgets | 30-50% | 5-15% | Lowest gross margins on this list. Competition is fierce, price sensitivity is high, and return rates are significant. Volume is everything. |
| Pet products | 50-65% | 12-22% | Growing market with strong repeat purchase behavior. Consumables (food, treats) have lower margins but higher LTV. Accessories have higher per-order margins. |
| Sports & fitness | 45-60% | 10-18% | Seasonal demand creates inventory risk. Technical apparel has better margins than equipment. Niche specialization (yoga, climbing, cycling) outperforms generic. |
| Kids & baby | 50-65% | 10-20% | Parents buy in bursts (growth stages) with high AOV. Safety compliance adds costs. Gifting season (holidays, baby showers) drives peaks. |
| Print on demand | 30-50% | 8-20% | COGS is fixed by the POD provider — you control only the markup. Zero inventory risk, but slim margins mean ad efficiency is critical. |
| Dropshipping | 25-50% | 5-15% | Widest range because it entirely depends on niche and supplier. High-ticket dropshipping ($200+ items) can achieve 20%+ net. Low-ticket general stores often run at 5-8%. |
What drives the gap between gross and net
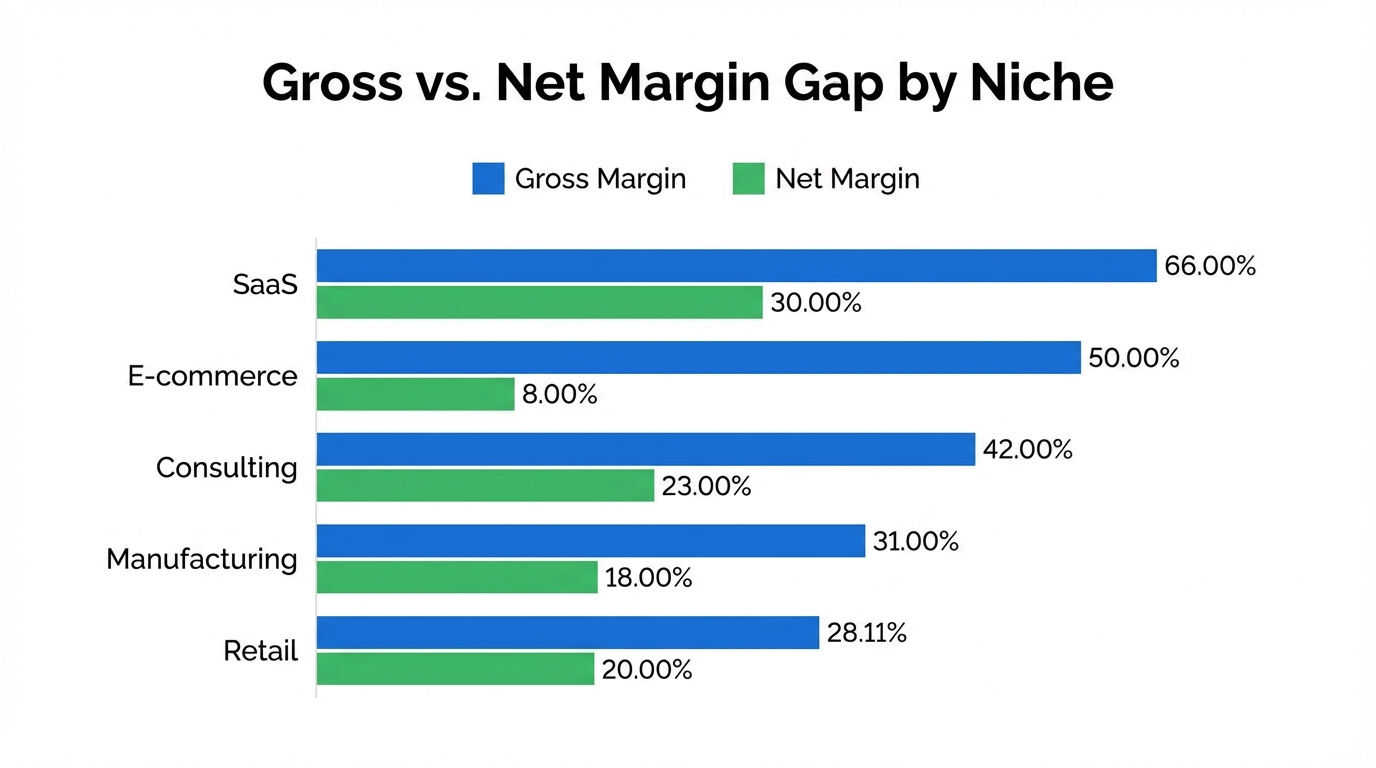
Looking at the table, the pattern is clear: most niches have a 35-50 percentage point gap between gross margin and net margin. That gap is where your money goes, and it's driven by a few key cost categories.
Ad spend: the biggest margin killer
For most Shopify stores, advertising is the single largest expense after COGS — and often larger than COGS. A beauty brand with 75% gross margin spending $15,000/month on Meta Ads against $25,000 in revenue is allocating 60% of revenue to ads alone. Gross margin says 75%. Net margin says 15%. That's the reality for a lot of paid-traffic-dependent stores.
The stores with the best net margins aren't necessarily the ones with the cheapest products. They're the ones with the most efficient customer acquisition — strong SEO, email lists, organic social, word-of-mouth. Every order that doesn't come from paid ads goes straight to the bottom line.
Shipping and fulfillment
In niches with heavy or bulky products (home, garden, furniture, electronics), shipping can eat 10-20% of revenue. If you offer free shipping — and most merchants feel they have to — that cost comes directly out of your margin.
For smaller, lighter products (jewelry, beauty, supplements), shipping is a smaller percentage but still adds up. A $4 shipping cost on a $25 order is 16% of revenue.
Returns
Apparel and fashion stores feel this the most. With return rates of 15-30%, a significant portion of your orders generate negative profit: you lose the processing fee, the outbound shipping, the return shipping, and sometimes the product itself. Returns are the main reason apparel net margins are so much lower than gross margins.
Platform and payment fees
Shopify's plan, payment processing, apps — these are smaller individually but stack up. A typical store spends 5-8% of revenue on platform-related costs. That's $5,000-$8,000 per year on $100,000 in revenue — money that never shows up in your Shopify reports unless you track it.
Want to see your real numbers?
Try our free profit calculator — plug in your numbers and see your real net margin in 30 seconds.
Try the free calculator →How to benchmark your own store
Knowing the industry averages is useful. Knowing where you sit relative to them is actionable. Here's how to do a quick benchmark.
Step 1: Calculate your gross margin
If you've entered cost per item in Shopify, go to Analytics → Reports → Profit by product. Add up total revenue and total cost. Gross margin = (Revenue - Cost) ÷ Revenue.
If you haven't entered costs, estimate your top 10 products (they usually represent 60-80% of sales) and calculate from there.
Step 2: Calculate your net margin
This requires adding up all your other costs for the month: shipping, processing fees, ad spend, Shopify plan, apps, and any other business expenses. Subtract everything from revenue. Net margin = (Revenue - All Costs) ÷ Revenue.
If you're not sure about some costs, start with the big three: COGS, ad spend, and shipping. Those typically account for 80-90% of total costs.
Step 3: Compare to the benchmarks
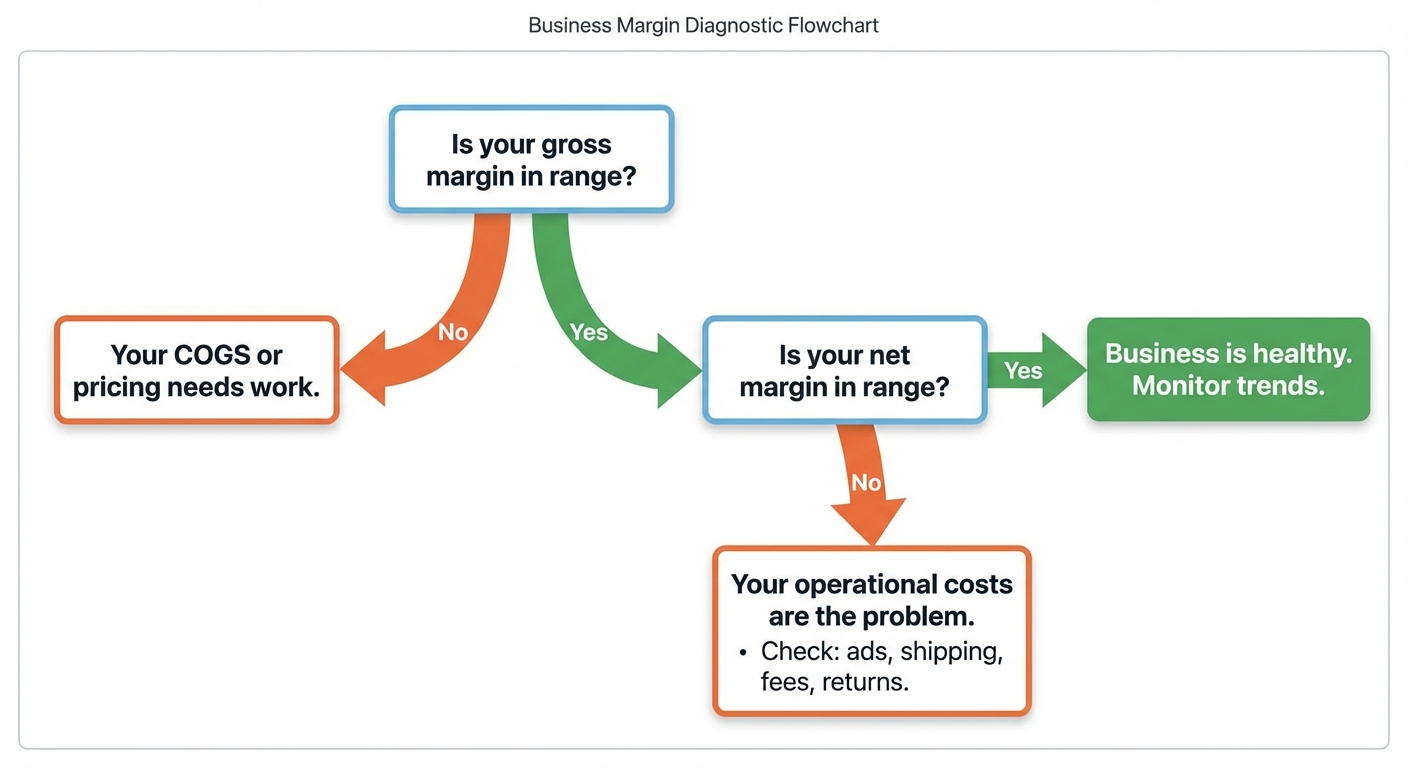
Look at where your gross and net margins fall relative to your niche range. If your gross margin is within range but your net margin is below range, the problem is in your operational costs — usually ads, shipping, or fees. If your gross margin itself is below range, the issue is COGS — you're either paying too much per unit or underpricing your products.
Step 4: Identify the gap
The single most useful diagnostic question: what's eating the difference between your gross and net margin? Is it ad spend (most common), shipping, returns, app bloat, or something else? Once you identify the category, you know where to focus.
What "good" actually looks like, by growth stage
Benchmarks also depend on where your store is in its lifecycle. A new store burning money on acquisition should have different margin targets than a mature store with strong organic traffic.
Early stage (0-$500K/year): Net margins of 5-15% are common and acceptable. You're investing heavily in acquisition and establishing product-market fit. The goal is to prove the unit economics work — positive margin per order, even if thin.
Growth stage ($500K-$2M/year): Net margins should be climbing toward 12-20%. You should see improving CAC as brand awareness grows, repeat customers increase, and you optimize ad spend. If margins aren't improving as you scale, something is structurally wrong.
Established ($2M+/year): Net margins of 15-25%+ are the target. Economies of scale in purchasing, established organic channels, and operational efficiency should all be compounding. If you're still at 8-10% at this stage, you're leaving money on the table — usually in ad spend efficiency or COGS negotiation.
The trajectory matters as much as the number. A 10% net margin that's improving by 2 points per quarter is healthier than a 15% net margin that's been flat for a year.
Seven levers to improve your margins
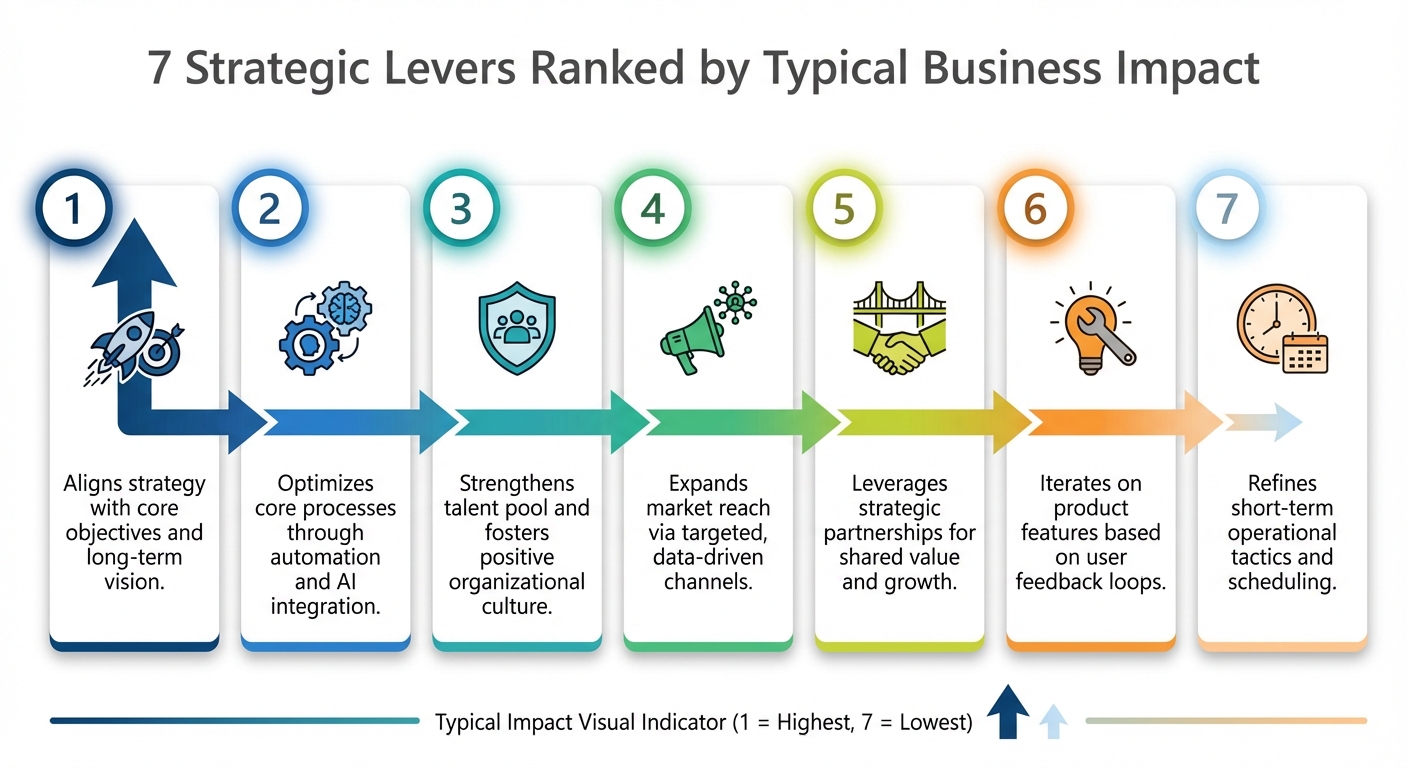
If your benchmarking reveals a gap, here are the most effective levers — ranked by typical impact.
1. Reduce customer acquisition cost. Build email lists, invest in SEO, create referral programs, and nurture repeat purchases. Every organic order drops your blended CAC and directly improves net margin.
2. Negotiate better COGS. As volume grows, renegotiate with suppliers. Even a 5% reduction in COGS translates directly to gross margin improvement. Consider consolidating orders for better freight rates.
3. Optimize shipping. Compare carriers regularly. Use regional carriers for domestic orders. Negotiate volume discounts. Consider whether your free shipping threshold is set correctly.
4. Reduce returns. Better product photos, accurate sizing guides, detailed descriptions, and quality control all reduce return rates. In apparel, a 5-point reduction in return rate can improve net margin by 2-3 points.
5. Audit your app stack. Most stores accumulate apps they no longer use or that overlap in functionality. A quarterly audit can save $100-$500/month with zero impact on operations.
6. Increase average order value. Bundles, minimum order incentives, and smart upsells increase revenue per order without proportionally increasing costs. Fixed costs like processing fees and packaging are spread across a larger sale.
7. Adjust pricing. If your margins are consistently below your niche benchmark and you can't reduce costs further, your prices may be too low. A $2-3 increase on a $40 product is barely noticeable to customers but adds $2-3 to every order's profit.
Frequently asked questions
What's a good profit margin for a Shopify store?
It depends on your niche, but most healthy Shopify stores target a net margin of 10-25%. Beauty and jewelry brands tend toward the higher end (15-28%), while electronics and dropshipping sit lower (5-15%). More important than hitting a specific number is understanding whether your margin is improving over time.
Is 20% net margin good for e-commerce?
Yes — 20% net margin puts you in the upper range for most e-commerce niches. It typically indicates efficient customer acquisition, well-managed COGS, and controlled operational costs. Many successful Shopify stores operate profitably at 12-18%.
Why is my gross margin high but my net margin low?
The gap is caused by operational costs that sit between gross and net profit: ad spend, shipping, payment processing fees, returns, and platform costs. Ad spend is the most common culprit. If you're spending 30-40% of revenue on ads, a 70% gross margin becomes a 10-15% net margin quickly.
How do dropshipping margins compare to brand-owned stores?
Dropshipping typically has lower gross margins (25-50% vs 50-80% for brand-owned) because the supplier captures the manufacturing margin. Net margins can be comparable (5-15%) for well-run dropshipping operations, but the ceiling is lower and there's less room for error.
Should I compare myself to other Shopify stores or to the broader industry?
Compare to your specific niche first. A 15% net margin means very different things in beauty vs electronics. Then compare to stores at a similar revenue stage — a $100K/year store has structurally different margins than a $5M/year store in the same niche.
Know your numbers, know your niche
Margin benchmarks aren't targets to hit — they're reference points that tell you whether your business economics are in a healthy range for your niche and growth stage. A gross margin tells you how much room you have. A net margin tells you how much of that room you're keeping.
The merchants who consistently outperform their niche benchmarks share one trait: they track both numbers, regularly, and they know exactly which cost categories are driving the gap between them.
Want to see your gross and net margin by product, by channel, and by day — automatically? Try Shopimize free and benchmark your real profitability in minutes.