
Shopify Profit Calculator: What It Misses (And What to Use Instead)
You've probably used one. You punch in your monthly revenue, subtract your COGS, add a rough estimate for "other expenses," and out pops a number: your profit.
It feels good. It's fast. It's simple.
And it's almost certainly wrong.
[IMAGE PLACEHOLDER: Screenshot of a generic online calculator showing revenue/COGS/expenses fields]
The problem with most free Shopify profit calculators isn't that they're bad at math. It's that they're designed to be simple — which means they ignore the messy reality of how ecommerce actually works. They treat profit like it's a clean formula, when in reality it's buried under layers of per-order costs, payment fees, refunds, and ad attribution that shift every single day.
We've watched hundreds of Shopify stores use calculator tools, feel confident about their numbers, and then get blindsided when actual profitability turned out to be 30–40% lower. That gap isn't a math error. It's a data gap.
Here's what's missing.
The 5 Things Most Shopify Profit Calculators Miss
1. Per-Order Variable Costs (Not Averages)
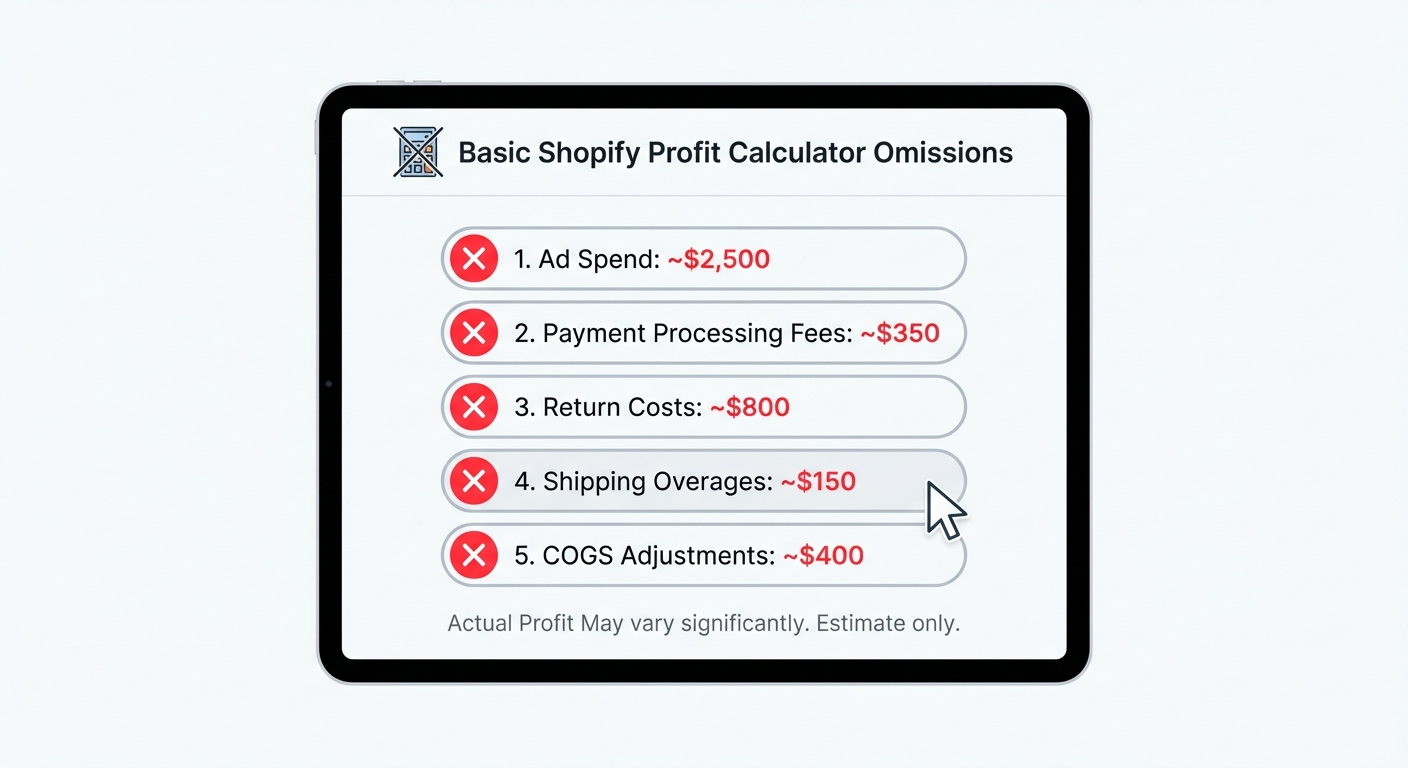
Most calculators ask you one question: What's your average COGS?
Then they assume every order has identical variable costs.
In reality, each order is different.
One customer orders a single high-margin product and ships domestically. Another orders five items, triggering tiered shipping, and ships internationally. A third returns half their order. These aren't edge cases — they're your actual business.
Why it matters: If you assume 30% COGS across the board but some orders are 45% COGS (because they're bulkier or lower-margin items), you're overstating profit on those orders. When that happens systematically, your calculator says you're profitable when you're actually scraping by.
Shipping is the same problem. Calculators often use an average shipping cost, but you know the truth: a 5oz item ships cheaper than a 2lb item. A domestic order is cheaper than international. A $50 order might have subsidized shipping; a $15 order doesn't.
2. Gateway-Specific Processing Fees (They Use One Flat Rate)
This one's sneaky because the variance is real but small on a per-order basis — until you look at volume.
Shopify Payments charges around 2.9% + 30¢. PayPal charges 2.9% + 30¢. Shop Pay might be lower if you negotiate. Affirm, Klarna, and other buy-now-pay-later providers charge 3.5%+. Cryptocurrency payments are even higher.
Most calculators ask: What's your payment processing fee? Then they apply that rate to every order.
But your customer mix determines which gateways they use — and that mix shifts over time.
Real example: A store with 100 orders per month might process 60 via Shopify Payments, 25 via PayPal, and 15 via a BNPL option.
- Shopify Payments on $60K: ~$1,770 in fees
- PayPal on $25K: ~$725 in fees
- BNPL on $15K: ~$525+ in fees
- Total: ~$3,020
A flat-rate calculator assuming 2.9% across the board would calculate ~$2,900. The difference isn't huge here — but when you're running multiple payment gateways and your mix changes seasonally, it adds up.
3. Refund and Chargeback Costs (They Ignore This Entirely)
This is the killer that most calculators miss completely.
When a customer returns an item, you don't just lose the profit on that order. You lose:
- The payment processing fee that was already collected
- The shipping cost you already paid
- The refund processing fee (if applicable)
- The time and materials to restock or process the return
A calculator says: "Revenue - COGS = gross profit. Subtract expenses."
It doesn't say: "And then someone returns the order, so you lose $X and waste time."
Real example: A $100 order with $35 COGS ships for $10.
- Gross profit: $100 - $35 - $10 = $55
- Processing fees (2.9% + 30¢): ~$3.20
- Net after processing: ~$51.80
Now the customer returns it.
- You refund $100
- You lose the original shipping cost: -$10
- You lose the processing fee on the refund (yes, you have to pay it): -$3.20
- You might lose the original processing fee too depending on your gateway: -$3.20
- You have a damaged/restocked item: -$15 in value
Real profit swing: +$51.80 → -$6.40
If your return rate is 5% (not uncommon), a calculator that doesn't account for this is systematically overstating profit by thousands per month.
Chargebacks are even worse because you often lose the fee twice plus a $15 chargeback fee.
4. Ad Spend Attribution (They Use a Lump Monthly Number)
Calculators treat ad spend like a fixed monthly cost. You tell it: "I spend $3,000 on ads per month."
Then it subtracts $3,000 from profit and calls it done.
But here's the problem: not all ad spend is equal. And not all ad spend is directly tied to the orders you're counting.
The reality:
- Some ads generate immediate sales (a customer sees your ad, clicks, buys today)
- Some ads generate returning customers (brand building, awareness)
- Some ad spend is completely wasted (targeting errors, poor creative, wrong audience)
- Some orders are attributed to ads when they would've happened anyway
A simple calculator can't untangle this. It just deducts the lump sum and hopes.
Worse: if you're a multi-channel seller (Shopify + Amazon + TikTok Shop), ad spend attribution becomes critical because different channels have different customer acquisition costs. A calculator designed for one channel is useless for understanding real profitability when you're selling everywhere.
5. Time-Based Cost Changes (Everything Fluctuates)
A calculator takes a snapshot: "Here's your current COGS, here's your current shipping cost, here's your current ad spend."
But nothing stays constant.
- COGS fluctuates with supplier pricing, bulk discounts, and currency exchange rates
- Shipping rates change seasonally and with carrier adjustments
- Ad costs spike during Black Friday, Cyber Monday, and holiday season
- Payment processing rates can improve with volume commitments
A calculator that tells you "your profit margin is 24%" in January might be completely wrong by July.
Why it matters: You make business decisions based on that static number. You might decide to run a promo that's actually unprofitable during peak season. You might keep running ads at a CAC that was true three months ago but isn't true now.
The only way to catch this is with real-time tracking that updates as costs change.
What Profit Really Looks Like: A Worked Example
Let's walk through a real scenario. A skincare brand does $28K in revenue in a single month.
[IMAGE PLACEHOLDER: Visual breakdown of order flow showing revenue to net profit calculation with multiple cost categories]
What a Simple Calculator Says:
- Revenue: $28,000
- COGS (assume 35%): -$9,800
- Gross Profit: $18,200
- "Other expenses" (assume $8,000): -$8,000
- Profit: $10,200
- Margin: 36%
Looks great, right? Now let's get real.
What Actually Happened That Month:
Revenue breakdown:
- 280 orders at $100 average
COGS (actual, per order):
- 120 orders at $28 COGS (lower-margin products): $3,360
- 110 orders at $35 COGS (mid-tier): $3,850
- 50 orders at $50 COGS (premium, bundled): $2,500
- Total COGS: $9,710 (calculator was close: $9,800)
Shipping costs:
- 200 domestic at $4.50 average: $900
- 80 international at $18 average: $1,440
- Total Shipping: $2,340 (calculator assumed $8,000 "other," so we're fine here)
Payment processing fees:
- 210 orders via Shopify Payments (2.9% + 30¢): $610
- 50 orders via PayPal (2.9% + 30¢): $145
- 20 orders via BNPL (3.5%): $98
- Total Processing: $853 (calculator didn't account for this separately)
Refunds & chargebacks:
- 18 full refunds (6.4% return rate, higher than industry average): customer refunded $1,800
- Original shipping refunded: -$81
- Processing fees paid on refund: -$52
- Chargeback fees: -$27
- Lost margin on returned items (assume 40% not restockable): -$252
- Total Refund Cost: -$1,212
Subscription management fees:
- Shopify plan: $299
- Apps (inventory, marketing, shipping): $145
- Total Platform: $444 (calculator might have included this, might not)
Ad spend:
- Google Shopping: $3,200
- Facebook/Instagram: $2,100
- Email platform: $180
- Total Ad/Marketing: $5,480
Other fixed costs:
- Packaging & supplies: $340
- Accounting/bookkeeping: $200
- Miscellaneous: $155
- Total Other: $695
The Real Numbers:
| Line Item | Amount |
|---|---|
| Revenue | $28,000 |
| COGS | -$9,710 |
| Shipping | -$2,340 |
| Processing Fees | -$853 |
| Refund/Chargeback Costs | -$1,212 |
| Platform & Apps | -$444 |
| Ad Spend | -$5,480 |
| Other Fixed Costs | -$695 |
| Net Profit | $4,266 |
| Margin | 15.2% |
The calculator said 36%. Reality is 15.2%.
That's not a mistake. That's the difference between thinking you're building a profitable business and realizing you need to fix something fast.
When a Calculator IS Useful
We're not saying profit calculators are worthless. They're not.
They're great for:
- Back-of-napkin math. Wondering if a new product idea makes sense? Run the numbers through a calculator. Fast, dirty, good enough.
- Pricing new products. You need a starting point for a margin target. A calculator helps.
- Sanity checks. You processed $50K in revenue last month — does that $12K profit number feel right? A calculator confirms it's in the right ballpark.
- Teaching. If you're new to ecommerce and want to understand the basic concept of profit, a calculator is a clear starting point.
But if you're running a store with consistent orders, growth targets, or any paid marketing, a calculator will let you down.
Want to see your real numbers?
Try our free profit calculator — plug in your numbers and see your real net margin in 30 seconds.
Try the free calculator →When You Need More Than a Calculator
You need real profit tracking when:
- You're doing 500+ orders per month. At that volume, the small errors in a calculator compound. A 1% accuracy error costs you hundreds.
- You're selling across multiple channels. Different channels have different costs. A single calculator can't handle this.
- You're running paid ads. Ad spend is your second-largest cost after COGS. You need to see which ads actually drive profit, not just revenue.
- You have variable costs. If your COGS, shipping, or returns fluctuate (and they do), you need tracking that updates automatically, not a static number.
- You're making pricing or product decisions. You can't confidently decide to discount a product or run a margin-heavy promo without real profit data.
What Real Profit Tracking Looks Like
Instead of plugging numbers into a calculator once a month, real profit tracking:
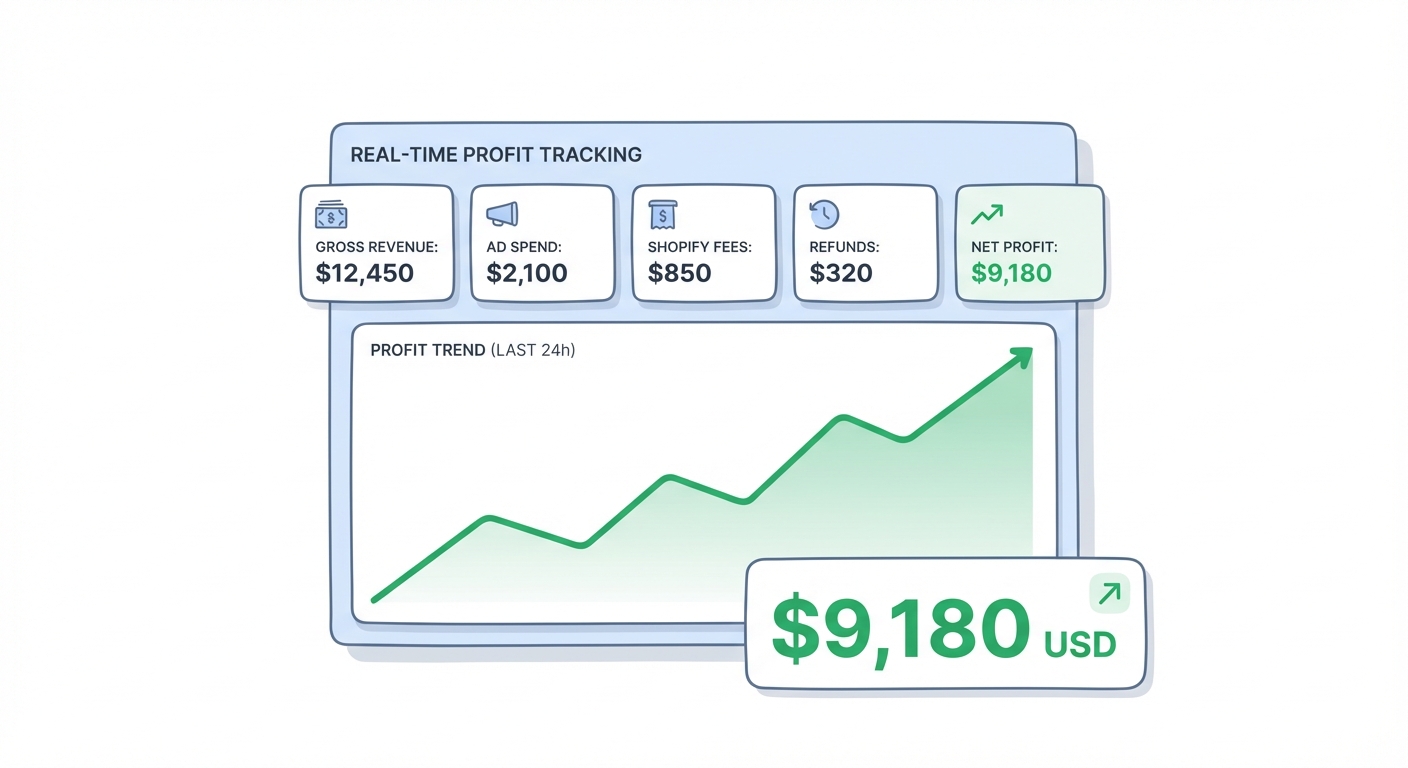
- Captures every order. The moment a customer places an order, the system logs the revenue, COGS, shipping, and payment fees.
- Handles refunds automatically. Returns are processed in real-time, showing the true cost of refunds including lost fees and restocking.
- Tracks variable costs per order. Not averages — actual costs. Different products, different shipping routes, different payment methods.
- Attributes ad spend to real orders. Tools like UTM tracking and pixel attribution tie ad spend back to the actual customers it acquired.
- Updates over time. As COGS changes, shipping rates shift, or ad costs climb, the profit number reflects reality today, not yesterday.
- Breaks down profit by channel, product, and customer. So you see not just overall profit, but which products are actually worth selling and which channels are actually driving margin.
This is what separates stores that scale profitably from stores that grow but barely break even.
Building a Shopify Profit Calculator (And Why We're Considering It)
We get asked a lot: "Can you build an interactive calculator on your site?"
The honest answer is that a truly useful one is complicated. Because if we're building a calculator, we'd want it to be different from every other one out there. We'd want it to account for real variable costs, multiple payment gateways, refund rates, and at least a basic ad spend attribution model.
In other words, a calculator worth using.
We're exploring this. But here's the thing: even the best calculator is still a snapshot. It's useful for validation and planning, but it's not a substitute for real tracking.
The Gap Between Calculator Profit and Real Profit
Here's what we've observed after working with hundreds of Shopify stores:
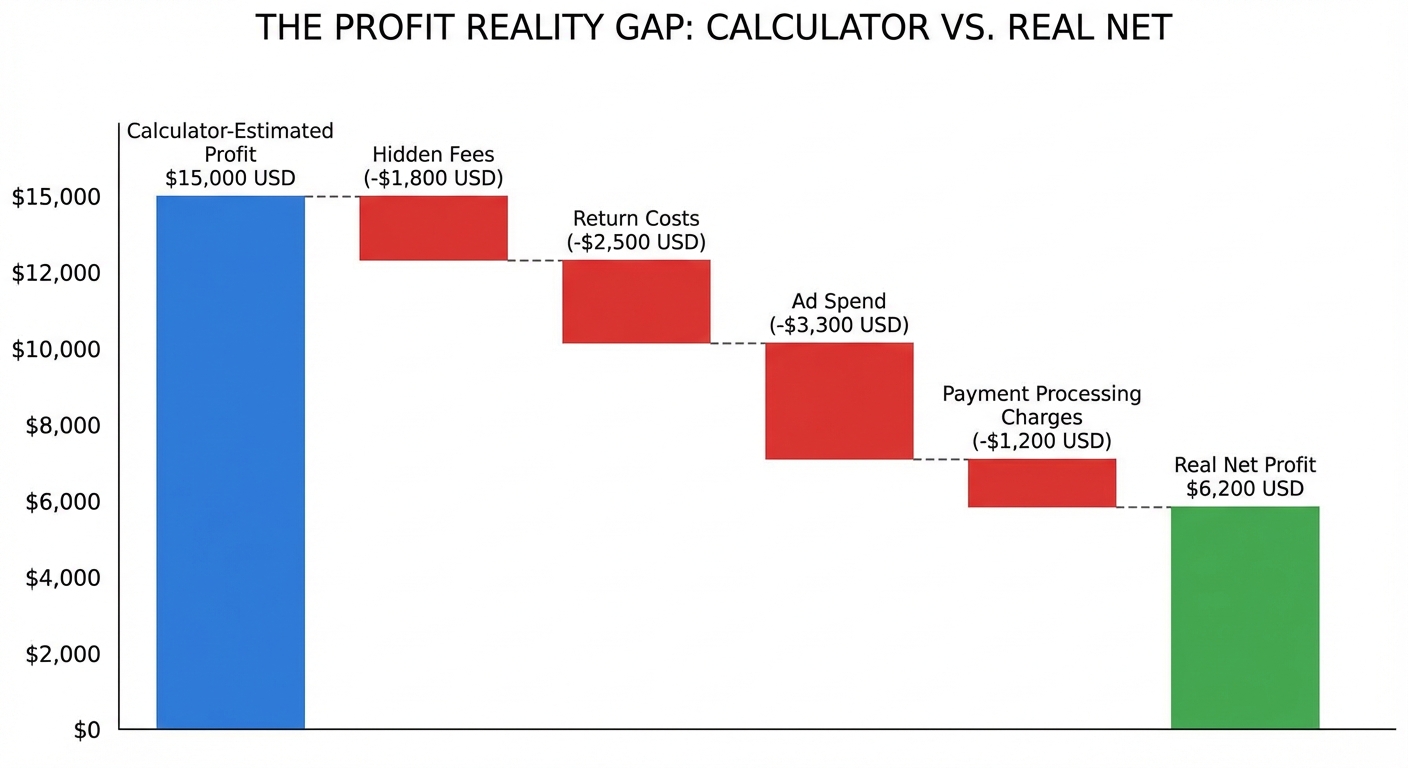
The stores that fail aren't usually the ones with bad products or bad marketing. They're the ones that didn't see the gap between what their calculator said they were making and what they actually made.
They thought they were 30% margin stores and they were 12% margin stores. By the time they realized it, they'd made business decisions based on a lie. They'd discounted products that couldn't sustain discounts. They'd scaled ad spend beyond what the actual profit could support. They'd hired team members and committed to inventory based on inflated numbers.
The gap between calculator profit and real profit is where most stores lose money without realizing it.
FAQ
Can I just use Shopify's built-in reports to calculate profit?
Shopify's reports show revenue and COGS, but they don't break down payment fees, shipping costs, refund costs, or ad attribution in a way that's easy to pull into a profit calculation. You'd have to manually pull from multiple sources and do the math yourself. Most store owners don't have time for that, so they reach for a calculator instead.
What if I just use an accounting tool like QuickBooks?
Accounting tools are great for post-hoc analysis — understanding what you spent last quarter. But they usually have a lag, and they don't help you understand profit per order or per product in real-time. You need both: accounting for compliance, and real-time tracking for decision-making.
How often should I calculate profit?
If you're using a calculator, monthly is reasonable. If you have real tracking, you should check daily or weekly. You'll catch problems (a refund rate spike, a payment gateway fee increase, an ad cost creep) much faster.
Is a 20% profit margin good?
It depends on your costs and business model. A product-based ecommerce store typically targets 20–40% net profit margin, but it varies wildly by category and business maturity. A store doing $10K/month might operate at 10% margin because fixed costs are high. A store doing $500K/month might hit 35% margin because fixed costs are spread across more orders.
The real question isn't "Is 20% good?" It's "What margin do I need to hit my growth goals and sustainability targets?" A calculator can't answer that. Real tracking can.
Do I need to track profit by product?
Not immediately, but eventually yes. Once you have a few dozen SKUs, you'll find that some are profitable and some are margin-killers. Knowing which is which changes your sourcing, pricing, and marketing strategy. A calculator can't give you this granularity.
What if I'm just starting out?
At the very beginning (first 100 orders), a calculator is fine. You need to learn the basics. But as soon as you hit consistent monthly sales, move to real tracking. The cost of being wrong about profitability grows with your business.
Want more than a calculator — real-time profit tracking across every order, every product, every channel? Try Shopimize free and see the numbers that actually matter.