
7 Proven Ways to Increase Your E-commerce Profit Without Raising Prices
Raising prices feels risky. Your customers might leave. Competitors might undercut you. You might lose the market share you've worked so hard to build.
But here's what most store owners don't realize: you don't have to raise prices to increase profit.
In fact, many of the most profitable e-commerce businesses I've worked with hit their growth targets without touching the price tag once. Instead, they squeezed efficiency from the operations underneath—the cost of goods, the cost of getting a customer, the cost of processing an order.
That's where real leverage lives.
This article breaks down seven proven profit levers you can pull right now. Each comes with a specific dollar impact estimate, implementation steps, and real examples. None of them require price increases. All of them compound over time.
Let's get to work.
Why Profit Optimization Matters More Than Revenue
Before we jump in, a quick reality check.
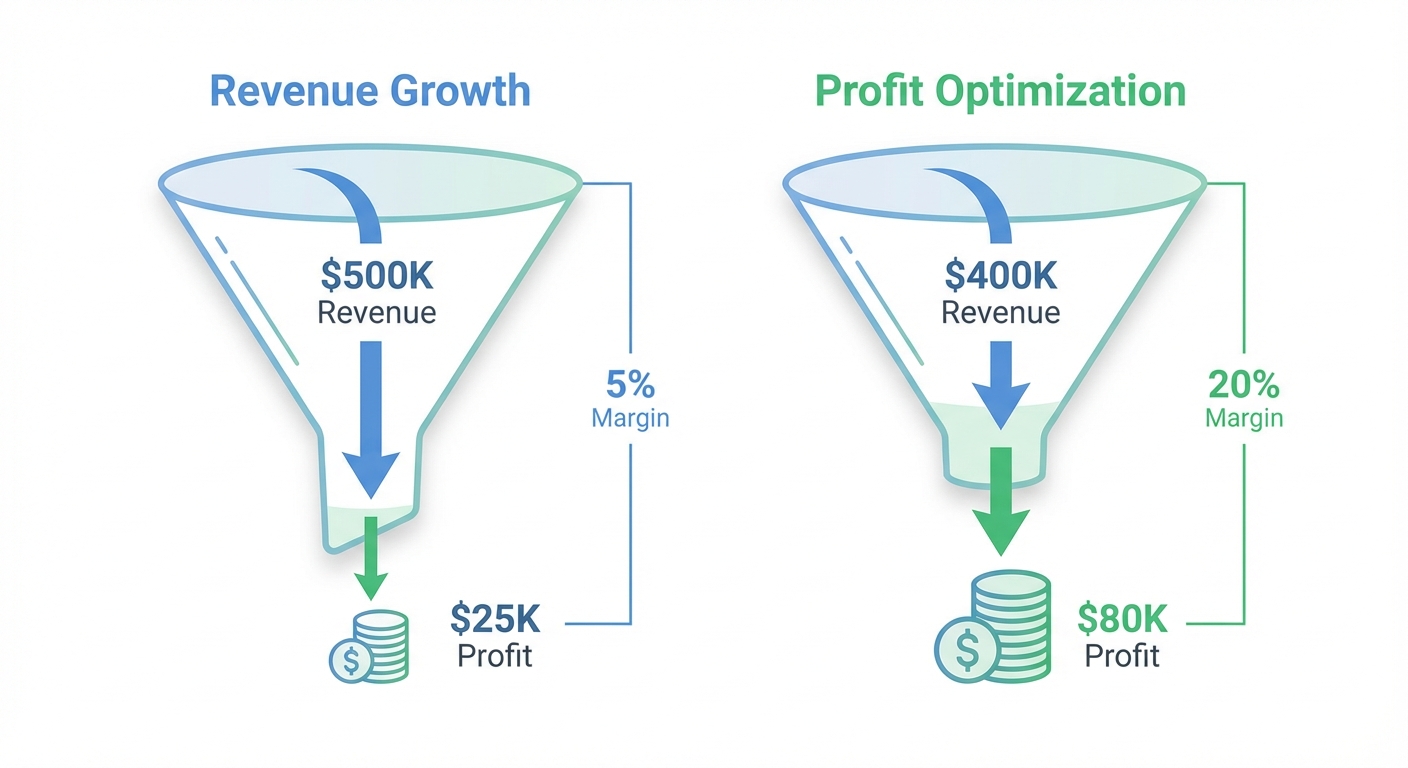
Most founders obsess over revenue. $100K MRR feels like success. But revenue ≠ profit.
A $100K-per-month store might pocket $8,000 in profit (8% margin) or $35,000 (35% margin). The difference is everything. It's hiring decisions, reinvestment capacity, and whether you can actually survive a bad quarter.
Profit margins are built in the operations, not the headline number. That's why product-level margin analysis—knowing exactly which items make you money and which ones drain it—is table stakes for any serious seller.
The good news? Most stores have substantial margin leaks they've never measured. When you find and plug them, the profit gains are immediate and compounding.
1. Negotiate COGS with Suppliers (5–15% Improvement)
Your cost of goods sold (COGS) is usually your largest expense line. Even a small reduction cascades down.
The Math:
- Current COGS: $20,000/month
- Supplier reduction negotiated: 5%
- Monthly savings: $1,000
- Annual impact: $12,000 (before tax)
How to Execute:
- Audit your current suppliers. Pull 12 months of purchase data. Rank suppliers by spend volume. The top 3 usually account for 60–70% of your COGS.
- Get alternative quotes. Use platforms like Alibaba, Global Sources, or 1688 (if sourcing from Asia). Request quotes at your actual order volumes. Include shipping and lead times in your analysis—a 10% cheaper unit cost doesn't matter if shipping doubles.
- Prepare a negotiation brief. Document:
- Your annual spend with them
- Growth rate (if you've been growing, lead with it)
- Willingness to commit to a longer contract (in exchange for discounts)
- Current quality and delivery performance
- Make the ask. Most suppliers expect negotiation. Try these approaches:
- "We're growing 30% YoY. If you can hit $X unit cost, we'd lock in a 12-month commitment."
- "Competitor X quoted us at $Y. Can you match?"
- "Volume commitment in writing for Q4—can you improve the unit cost?"
- Negotiate terms, not just price. Lower upfront costs, extended payment terms (net 30 instead of net 15), or free freight on orders above a threshold.
Expected Impact Range: 2–8% COGS reduction is realistic for most sellers. Aggressive negotiators or those with scale can push to 10–15%.
Reality Check: This lever works best if you have meaningful volume ($5K+/month COGS) and aren't already at the lowest-cost supplier. If you're buying from a hyper-competitive market (apparel, electronics), margins are thinner and negotiation room is smaller.
2. Reduce Return Rates (5–20% Annual Savings)
Returns are profit assassins. They're hidden profit leaks: the lost margin on the original sale, the reverse logistics cost, potential refurbishment costs, and the likelihood that returned merchandise becomes a discount item.
The Math:
- Current monthly revenue: $30,000
- Average margin per order: 40%
- Current return rate: 15% (industry average for e-commerce)
- Implied monthly margin impact: ~$1,800
- Annual profit loss to returns: ~$21,600
- Scenario: Reduce return rate to 10%
- Annual savings: ~$7,200 (from a $30K/month store)
How to Execute:
- Measure your actual return rate. It's orders returned ÷ total orders shipped. Don't estimate—pull the data.
- Segment by category. Some product types return at 5%, others at 35%. Focus on the worst performers first.
- Investigate the root causes. Common culprits:
- Poor fit (apparel): Provide detailed size charts. Add customer photos of people wearing items. Consider a "fit guarantee" at checkout.
- Quality issues: Inspect before shipment. Tighten QC with suppliers.
- Mismatched expectations: Your product photos or descriptions are misleading. A customer expects X, receives Y.
- Wrong product: Shipping errors. Use barcode scanning at pack/ship.
- Fix the biggest leak first. If 60% of returns are "wrong size," size chart improvement is your MVP. If it's quality, that's a supplier issue (see lever #1).
- Communicate pre-purchase. Clear photos, dimensions, material content, and care instructions reduce surprises. A video of the product in use (on a real person, in a real setting) is powerful.
- Incentivize exchanges over refunds. "Return shipping free if you exchange; return shipping costs $10 if you refund." You recover a customer at a lower cost than acquiring a new one.
Expected Impact Range: 2–8% return rate reduction (from 12% to 10%, or 18% to 14%) is achievable for most stores in 30–60 days. Better messaging and sizing info compounds quarterly.
Reality Check: If your return rate is already 5%, you're ahead of the curve. Focus here only if you're above 12%.
Track this automatically
Shopimize shows your real profit per order, per product, per channel.
Try Shopimize free →3. Optimize Ad Spend Efficiency (Lower CPA by $1–5)
Paid ads scale revenue, but they're often the first place margin gets destroyed. Wrong audience. Wrong creative. Bidding wars on breakeven keywords.
The Math:
- Current order volume: 500 orders/month
- Current Customer Acquisition Cost (CPA): $18
- New CPA after optimization: $15
- Monthly savings: $1,500
- Annual impact: $18,000
How to Execute:
- Segment your ad spend by channel and campaign. Know your CPA by source (Facebook, Google, TikTok, Pinterest). Most stores have 20% of campaigns driving 80% of profitable volume.
- Audit your lowest-converting campaigns. If a campaign has:
- Cost Per Click (CPC) above your AOV ÷ 10
- Click-through rate (CTR) below 1% (Facebook) or 2% (Google)
- Conversion rate below 1%
Pause it. Reallocate budget to winners.
- Test audience tightening. Broad audiences often feel good (lots of clicks) but waste spend. Try:
- Narrowing age/income range
- Targeting competitor product audiences
- Using your own customer data (lookalike audiences)
- Testing interest-based segments
- Refresh creative every 2–3 weeks. Ad fatigue is real. Audiences see the same ad, CTR drops, CPC rises. Fresh creative (even small variations) often improves efficiency 15–25%.
- Implement dynamic pricing in ads. If you test a lower price point in ad copy (even a temporary promotion), you may find the CPA improves while revenue holds steady.
- Use UTM parameters and pixel tracking religiously. You can't optimize what you don't measure. Track not just conversions but post-purchase customer value (repeat purchase rate, AOV of repeat orders).
Expected Impact Range: 5–15% CPA reduction in 30–60 days (through tightening audience and pausing low performers). Sustained 10–20% improvements come from creative testing and channel diversification.
Reality Check: This works best if you're already spending $1K+/month on ads. If you're at $200/month, the data is too thin to segment meaningfully. Also: this assumes your product margins can sustain the CPA. If your gross margin is 30% and CPA is already $20 on a $50 AOV, you're near the ceiling.
4. Increase Average Order Value Through Bundles and Upsells (10–25% Margin Uplift)
This is the most underrated profit lever in e-commerce.
Here's why it's so powerful: when AOV increases, fixed costs per order stay the same. Shipping cost per unit goes down. Payment processing fee per unit goes down. Customer support cost per dollar is lower. You keep more of every additional dollar.
The Math:
- Current AOV: $45
- Current orders: 500/month
- Current gross margin: 40%
- Implied monthly gross profit: $9,000
- Scenario: AOV increases to $52 (15% lift)
- New monthly gross profit: $10,400
- Additional monthly profit: $1,400
- Annual uplift: $16,800
How to Execute:
- Build product bundles. Take slow-moving or low-margin items and pair them with bestsellers. Example: "Skincare Bundle: Cleanser + Moisturizer + Eye Cream = $49" (vs. $35 + $28 + $22 bought separately). You're adding value (and margin) without raising prices.
- Implement post-purchase upsells. On the order confirmation page or in an email 1 hour after purchase, offer a complementary product at a discount. Example: "Just bought our yoga mat? Get 20% off our yoga block." Conversion rates on post-purchase upsells are 5–15% (way higher than cold ads).
- Create volume discounts strategically. "Buy 2, get 5% off" or "Buy 3, get 10% off." You're increasing order value and margin (because fixed costs are spread wider). Don't discount so heavily that unit margin collapses—test a few tiers.
- Use scarcity and bundling in your email flows. In a welcome series, or in a browser-abandonment email, you might write: "Complete Your Look: Get the Jacket + Matching Scarf for $79 (instead of $85 bought separately)."
- Segment upsells by customer history. A customer who's bought 3x from you should see different upsells than a first-time buyer. Someone who bought your premium tier should see complementary premium products, not your entry-level items.
- Track bundle profitability obsessively. A bundle that looks good on paper (high AOV) might have terrible margin if you've discounted too far or if the bundle includes items with high return rates. Measure margin per bundle, not just AOV.
Expected Impact Range: 8–20% AOV increase is realistic for most stores. The margin uplift is often 1.5–2x the revenue uplift because fixed costs are fixed.
Reality Check: This doesn't work if your product catalog is small (fewer than 5–10 SKUs). It's also less effective if you're in a category where bundling feels unnatural (e.g., selling a single speciality item). Also: upsells that are too aggressive ("Would you like fries with that?") create friction and cart abandonment. Test your messaging.
5. Cut Unused App Subscriptions (Quick $600–1,800/Year)
This is the easiest win on the list.
Most Shopify stores have 8–12 installed apps, and at least 2–4 of them are generating zero ROI. A review tool nobody uses. An inventory app installed 18 months ago and forgotten. A loyalty app that looked promising but got deprioritized.
The Math:
- Average app cost: $25–50/month
- Number of unused apps: 3–5
- Annual burn: $900–3,000
- Realistic recovery: $600–$1,800/year
How to Execute:
- Audit your current apps. Export a list from your app store (or just walk through your settings). For each app, ask:
- When did I last use this?
- What problem is it solving?
- Can I do this with a free tool or built-in feature?
- Segment into three buckets:
- Core (payment processing, shipping, accounting integration): Keep.
- Active (you log in monthly and it drives revenue or saves time): Keep.
- Passive (you're not sure if it's doing anything): Uninstall.
- Cancel the passive ones. Don't overthink it. If you haven't logged into an app in 3 months, you're not using it.
- Consolidate where possible. Many app suites do overlapping things. One all-in-one review + loyalty + SMS platform might cost less and require fewer monthly updates than four single-purpose apps.
- Track the ones you keep. Set a calendar reminder for Q1, Q2, Q3, Q4 to audit active apps. Platforms change, features evolve, and what made sense in January might not in July.
Expected Impact Range: $50–150/month in savings for most stores. For larger operations with 20+ apps, you might find $300+/month in waste.
Reality Check: This is quick money but also the smallest lever on the list. It's good hygiene, not a growth lever. Do it, but don't spend weeks here. Spend 30 minutes, cut the obvious waste, and move on.
6. Optimize Shipping Strategy (3–8% Margin Recovery)
Shipping is one of the most opaque costs in e-commerce. Most store owners ship however they shipped on day one, without revisiting the strategy.
The Math:
- Current monthly revenue: $50,000
- Average shipping cost per order: $7
- Monthly orders: 1,000
- Monthly shipping spend: $7,000
- Scenario: Optimize carriers, negotiate rates, reduce dimensional weight penalties
- Shipping cost reduction: 5–10% ($350–700/month)
- Annual savings: $4,200–$8,400
How to Execute:
- Audit your current shipping costs. Pull 3 months of shipping data. Calculate:
- Blended cost per shipment (total spend ÷ total shipments)
- Average weight and dimensions
- Carrier breakdown (% to USPS, UPS, FedEx, etc.)
- Dimensional weight charges (is this a big hidden cost?)
- Negotiate carrier rates. If you're shipping 500+ packages/month, you qualify for commercial rates better than retail. Contact each carrier's small business team:
- USPS: Priority Mail and Flat Rate improvements
- UPS: Negotiate on ground and 3-day rates
- FedEx: Sometimes has better rates on specific lanes
- Optimize packaging to avoid dimensional weight penalties. DIM charges apply when (Length + Width + Height) ÷ 166 > Actual Weight. Example:
- Current: 16"×12"×8" box = 4,608 ÷ 166 = 27.8 lbs charged (actual weight 5 lbs)
- Optimized: 14"×10"×6" box = 2,640 ÷ 166 = 15.9 lbs charged
- Savings: $1.50–$3.00 per shipment (if using FedEx)
- Consolidate regional carriers for certain lanes. RegionalCarrier A might be 40% cheaper than FedEx to the Northeast. Use the right carrier for the right geography.
- Offer free shipping at a higher threshold, or ship at cost. "Free shipping on orders $75+" converts better than charging $7.95. The margin uplift from higher AOV often offsets the shipping cost.
- Use calculated shipping rates at checkout. If you're using flat-rate shipping, you're either overcharging some customers (friction) or undercharging others (margin loss). Real-time rates based on destination and weight are more efficient.
Expected Impact Range: 3–8% shipping cost reduction is realistic. Aggressive optimization (packaging + negotiation + carrier switching) can hit 15%.
Reality Check: This lever is highly dependent on your current shipping model. If you're already using ShipStation with negotiated rates, there's less room to squeeze. If you're just guessing at your fulfillment costs and offering flat-rate shipping, there's huge upside.
7. Build Email and SMS for Repeat Customers (Highest Lifetime Value Leverage)
This is the profit lever that compounds hardest over time.
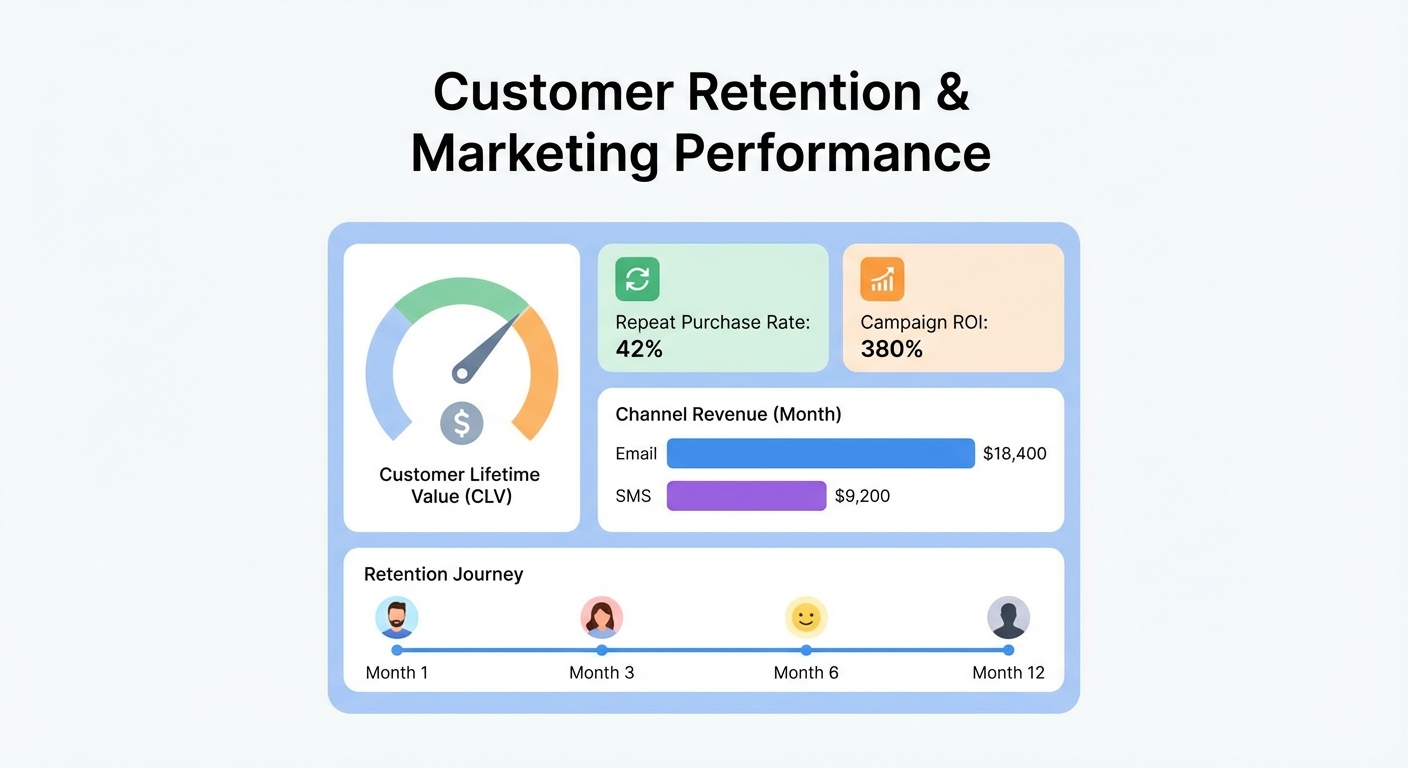
A repeat customer—someone buying for the second, third, or tenth time—has $0 acquisition cost. They already know your brand. They're more likely to buy, buy bigger, and accept slightly higher prices. Repeat customer margins are substantially higher than first-time customer margins because you're not spending to acquire them.
The Math:
- Current monthly new customers: 200
- Current repeat purchase rate: 15% (only 30 of your customers ever buy again)
- Current new customer acquisition cost: $20
- Average order value: $50
- Scenario: Build email/SMS workflows, increase repeat purchase rate to 35%
- New repeat customers per month: 70 (vs. 30 today)
- Repeat customer AOV: $55 (often higher, less price-sensitive)
- Repeat revenue per month: $3,850
- Repeat customer margin (no acquisition cost, ~45%): $1,732
- Current margin on new customers: $400
- Incremental monthly profit: $1,332 (from increasing repeat purchase rate alone)
How to Execute:
- Implement a post-purchase email sequence. This is your MVP:
- Day 1: Thank you, order confirmation, and a soft intro to your brand story.
- Day 3: Product care tips or related products they might like.
- Day 7: "Love your purchase?" with a request for review/feedback.
- Day 14: A discount on their next order (10–15% off, unique code).
- Build a re-engagement series. Target customers who bought once, 60+ days ago and haven't returned:
- "We miss you" email with a special offer (15–20% off).
- Follow-up 3 days later if they don't open or click.
- Segment: offer based on what they bought (if they bought a one-time item, focus on complementary products).
- Implement SMS for high-value segments. SMS open rates are 95%+ (vs. email at 20–30%). Use SMS for:
- Flash sales or limited-time offers (drives urgency, repeat purchase).
- New product launches (to previous customers first).
- Abandoned cart recovery (fastest channel for recovery).
- Build a loyalty/rewards program. Simple is better than complex:
- Points per purchase (e.g., 1 point per $1 spent).
- Redeem points for discount or free product.
- Bonus points for referrals or reviews.
- Segment email by purchase history, product category, and margin. A customer who bought your highest-margin item should see different offers than someone who bought your loss-leader product. A repeat customer should see different messaging than a first-time buyer.
- Measure cohort retention and LTV. Track: of customers acquired in January, what % buy again in Feb, Mar, Apr? What's their average LTV? This data drives all subsequent optimization.
Expected Impact Range: Repeat purchase rate increases of 5–15 percentage points are achievable in 60–90 days. Larger gains (20+ percentage points) come from sustained, segmented campaigns over 6+ months.
Reality Check: This lever has the highest long-term payoff but the longest compounding timeline. You won't see $1,000/month from repeat customer optimization on day 30. But on day 180? It's often the single biggest profit lever in the business.
Profit Leverage Comparison Table
| Lever | Implementation Difficulty | Time to Impact | Potential Monthly Impact | Annual Impact |
|---|---|---|---|---|
| 1. Negotiate COGS | Medium | 30–60 days | $500–$2,000 | $6K–$24K |
| 2. Reduce Returns | Medium | 30–90 days | $500–$1,500 | $6K–$18K |
| 3. Optimize Ad Spend | Medium | 14–30 days | $500–$2,000 | $6K–$24K |
| 4. Increase AOV | Low | 7–30 days | $1,000–$3,000 | $12K–$36K |
| 5. Cut Unused Apps | Very Low | 1 day | $50–$150 | $600–$1,800 |
| 6. Optimize Shipping | Low–Medium | 14–30 days | $300–$1,000 | $3,600–$12K |
| 7. Repeat Customers | Medium–High | 60–180 days | $500–$3,000 | $6K–$36K |
How to Prioritize (In Order of Implementation)
- Start with #5 (Cut apps). Takes 30 minutes, quick win, builds momentum.
- Follow with #4 (Increase AOV). Fastest margin impact. Bundles and upsells go live in days.
- Then #3 (Optimize ad spend). If you're running ads, this is low-hanging fruit. Quick wins (pause bad campaigns) come fast.
- Then #6 (Optimize shipping). Medium lift, meaningful impact. Do once, benefit every month.
- Then #1 (Negotiate COGS) and #2 (Reduce returns). These need more work but have structural impact. Negotiate with suppliers, then implement quality/fit initiatives.
- Finally, #7 (Repeat customers). This has the highest potential upside but longest timeline. Start it early (it's foundational), but don't expect outsized results in the first 90 days.
A Worked Example: How One Store Used All 7 Levers
Let's say you own a $40K/month e-commerce store (roughly $500K/year revenue):
Current State:
- Monthly revenue: $40,000
- Gross margin: 45%
- Monthly gross profit: $18,000
- COGS: $22,000
- Operating expenses: $10,000 (apps, ads, tools, etc.)
- Net profit: $8,000 (20% margin)
After Implementing All 7 Levers (conservatively):
- Negotiate COGS: 5% reduction = $1,100/month
- Reduce returns: From 18% to 12% = $800/month
- Optimize ads: CPA down $2 on 800/month orders = $1,600/month
- Increase AOV: From $50 to $55 = $3,200/month (net margin impact after increased fulfillment costs)
- Cut apps: $75/month
- Optimize shipping: 5% reduction = $150/month
- Repeat customers: Increase repeat rate 10 points over 6 months, incremental monthly impact = $1,500/month (growing)
New State (6 months in):
- Monthly gross profit: $18,000 + $1,100 + $800 + $3,200 = $23,100
- Operating expenses: $10,000 − $75 = $9,925
- New net profit: $13,175 (roughly 65% increase)
That's an additional $62,100 in annual profit from the same revenue base.
And that's conservative. Many stores see 2–3x those gains when they get serious about optimization.
FAQ
Q: Do all seven of these work for every store?
A: No. A store selling a single specialty item won't benefit from AOV upsells (lever #4). A store using already-optimal fulfillment won't find much in shipping (lever #6). Read each section's "Reality Check" to assess fit for your business.
Q: How do I know which lever to focus on first?
A: Start with the easiest (apps), then move to the highest-impact for your specific business. If you're running ads, optimize ad spend. If you have high returns, fix that. If you have low repeat rates, build email. Rank by effort ÷ impact.
Q: Can I do all seven at once?
A: You could, but I don't recommend it. Implementing seven operational changes at once creates chaos. You won't know which changes drove results. Pick two or three, execute well, measure impact, then move to the next batch.
Q: My store is very small ($5K/month). Do these apply?
A: Yes, but with caveats. Lever #1 (COGS negotiation) requires meaningful volume—probably wait until $10K+/month. Lever #5 (app cuts) still saves money. Lever #7 (repeat customers) compounds from day one. Lever #4 (AOV) is high-impact even at small scale.
Q: What if my margins are already tight (25% or less)?
A: You're more dependent on operational efficiency. Focus on #1 (COGS), #2 (returns), and #7 (repeat customers). These are structural levers. You might not be able to optimize ad spend because your margin doesn't support a high CPA.
Q: How do I measure the impact of these changes?
A: Use your analytics platform (Shopify, custom dashboard, or accounting software) to track:
- Gross profit per month (before and after each change)
- Specific metrics: COGS, return rate, CPA, AOV, repeat purchase rate, app spend, shipping costs
- Cohort analysis: customers acquired in January, repeat rate, LTV
Report on these monthly. You'll see which levers are actually working in your business.
Q: Is there a risk these changes could hurt revenue?
A: Some (mostly #2, #3, #4). Raising prices on upsells might reduce uptake. Being aggressive on COGS might force supplier switches with quality risk. Ad optimization might reduce volume. That's why you test, measure, and stay alert. But well-executed operational improvements rarely hurt revenue—they usually improve it because margins give you room to invest more smartly.
The Deeper Truth
Profit isn't about revenue. It's not about being the biggest seller in your market.
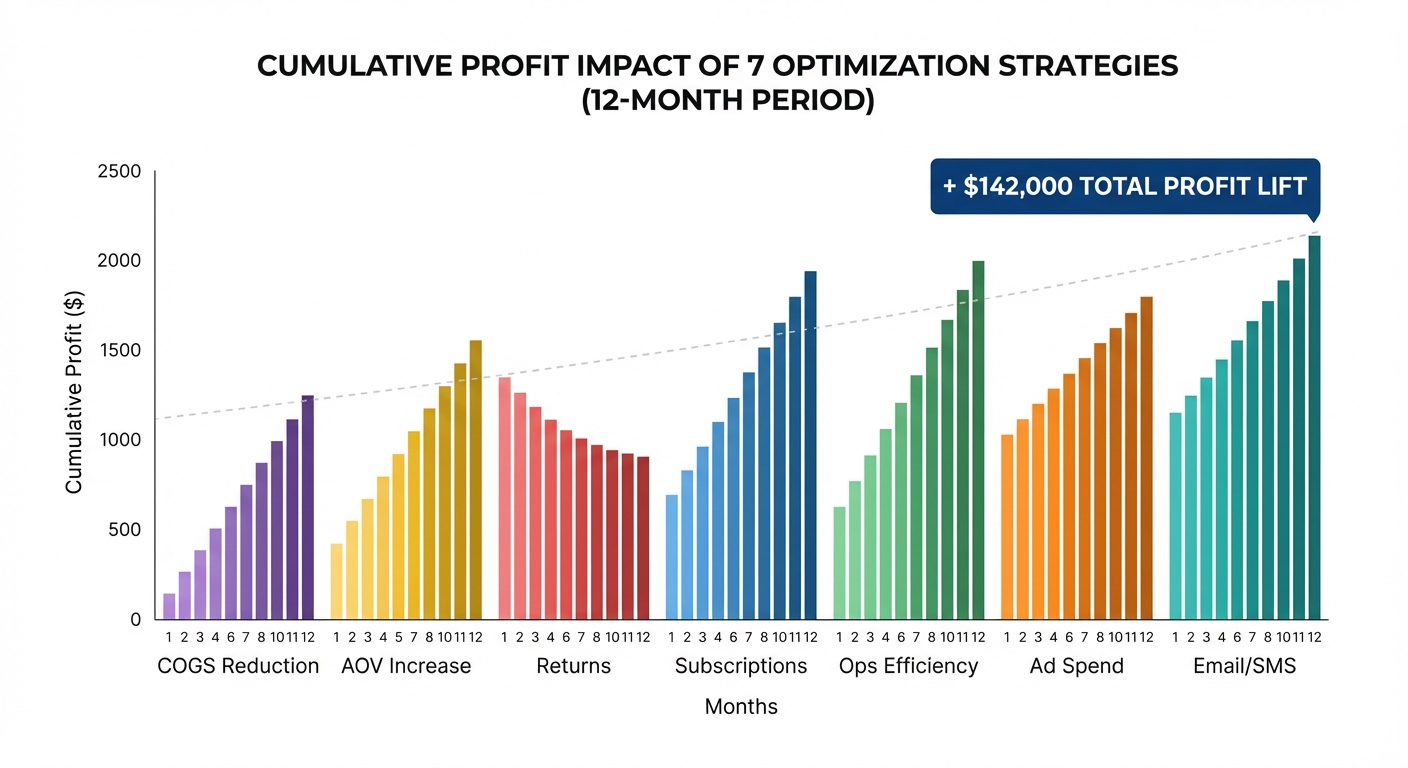
Profit is about knowing where every dollar comes from and where every dollar goes. It's about being ruthless with cost, thoughtful with pricing, and obsessive with leverage.
The seven levers above? They're the levers every profitable e-commerce business pulls. Some pull lever #1 harder (suppliers), others #7 (repeat customers). But all of them are pulled.
The stores that struggle aren't the ones in competitive markets or with low unit economics. They're the ones that don't know their numbers. They can't tell you their repeat purchase rate. They don't know which products are actually profitable. They're bidding on ads without knowing their CAC. They're shipping without optimization. They're burning $100+ a month on apps nobody uses.
Start measuring. Pick one or two levers. Execute. Measure again.
Repeat customer becomes profitable order becomes sustainable growth becomes a business that compounds.
[IMAGE PLACEHOLDER: Dashboard showing profit optimization metrics—margins by channel, repeat rate cohort, COGS trend, shipping cost per unit, etc.]
Ready to Get Serious About Profit?
The stores that win aren't always the biggest. They're the ones with the clearest picture of their economics.
Want to find the biggest profit levers in your store? Try Shopimize free and see exactly where your money goes. Know your margins by product, by channel, by customer cohort. Then optimize with confidence.
Your profit is waiting. Let's find it.