
How to Find Your Most (and Least) Profitable Shopify Products
Most Shopify stores have a dirty little secret: they're making money off maybe 20% of their products while the other 80% are dragging down profit margins. The frustrating part? You probably don't even realize which is which.
You look at your sales dashboard, see a product with 500 units sold, and think "that's our hero." But here's what you're missing: that hero might be hemorrhaging money while a product that's selling 20 units is quietly generating 40% margins.
Without product-level profit tracking, you're flying blind. And most Shopify stores are doing exactly that.
The good news? It's not hard to figure out. You just need a system.
The Profit Pareto You've Never Seen
You've probably heard of the 80/20 rule. In retail, it's deadly accurate: roughly 80% of your profit comes from 20% of your products.
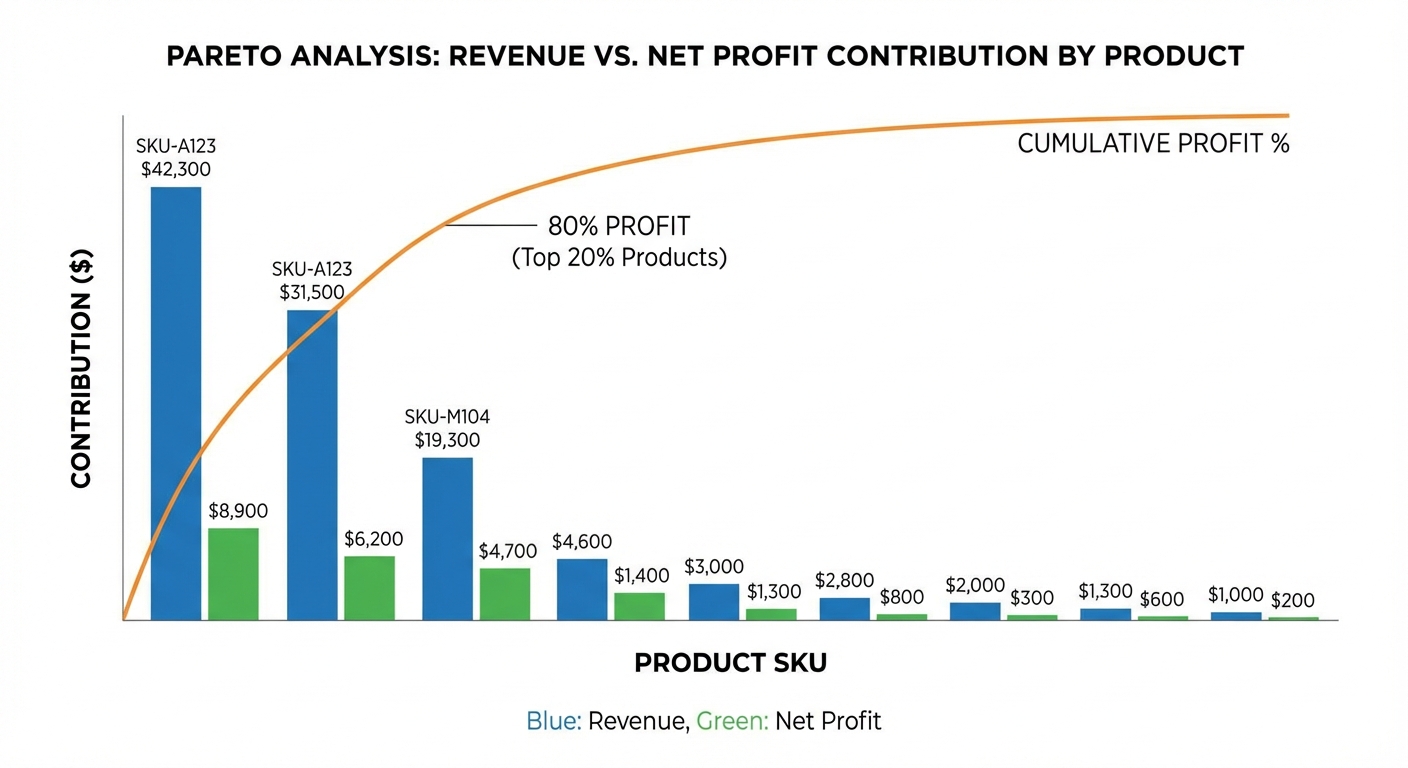
But here's the thing—that 20% isn't always your top revenue generators. Sometimes your bestsellers by unit volume are money losers. Sometimes your "slow movers" are your margin champions.
Without seeing this breakdown by product, you're:
- Spending marketing budget on low-margin bestsellers
- Missing the opportunity to scale your actual profit drivers
- Keeping unprofitable SKUs alive out of habit
- Bundling products wrong (or not bundling at all)
- Leaving money on the table with price optimization
The path forward is data. Real, product-level profit data. And we're going to walk you through exactly how to build that picture.
The Five-Step Methodology: From Revenue to Real Profit
Calculating which products are actually profitable isn't rocket science, but it does require you to be methodical. Here's the framework:
Step 1: Calculate True Cost of Goods Sold (COGS) Per Product
Most store owners know their product purchase cost. That's the easy part.
What they usually miss: everything else that goes into getting that product to your warehouse.
Your true COGS includes:
- Purchase cost from supplier (the wholesale or manufacturing price)
- Shipping to your warehouse (DHL, FedEx, ocean freight—whatever you're paying)
- Duty and tariffs (if importing)
- Packaging materials (boxes, tissue paper, padding—per unit)
- Labeling and stickers (if applicable)
- Quality assurance and returns to supplier (the reject rate from manufacturing)
Let's say you're selling a product with a $10 wholesale cost. But when you factor in inbound shipping ($2 per unit spread across the shipment), packaging ($1.50), and your supplier's defect rate (3% of units scrapped), your true COGS is closer to $14.
This is step one. Get it wrong, and everything downstream is fantasy.
Step 2: Add Variable Costs Per Order
COGS is just the product itself. But when someone buys, there are variable costs tied to that transaction.
These include:
- Payment processing fees (typically 2.9% + $0.30 per transaction, or higher for international)
- Shipping to customer (your actual fulfillment cost, not customer shipping cost)
- Logistics labor (picking, packing, quality check—per unit, if you do it in-house)
- Returns processing (restocking labor, inspections—we'll handle this more in Step 4)
If you're using a 3PL or Shopify Fulfillment Network, this might be a flat fee per unit. If you're doing it yourself, time it. Don't guess.
Step 3: Allocate Direct Ad Spend (If Applicable)
This is where most stores break down.
If you're running Facebook ads specifically for Product A, the cost of those ads is a direct cost of selling Product A. It's not overhead. It's product-specific profit killer—or maker.
You need to know:
- How many units of Product A you sold from that ad campaign
- The total spend on that campaign
- The allocation cost per unit (total ad spend ÷ units sold)
If you ran $500 in ads and sold 100 units, that's $5 per unit in ad cost. Some products might have $0.50 in ad cost (organic stars), while others might have $20 in ad cost per unit (because nobody wants them without paid promotion).
Step 4: Account for Return Rate by Product
Different products have different return rates. Clothing has higher return rates than electronics. Niche products have lower rates than commodity items.
Your return rate is critical because:
- Every return is labor cost (restock, inspection)
- Every return is freight cost (shipping back)
- Some returned inventory can't be resold (especially food, beauty, or hygiene items)
- Return rates directly reduce your effective units sold
If a product has a 20% return rate, you're effectively selling 80 units to cover 100 orders. That changes the math dramatically.
Return rate impact formula:
- Effective units sold = Orders ÷ (1 + return rate)
- Allocate all previous costs across effective units, not gross orders
Step 5: Calculate Contribution Margin Per Unit
Now you can do the math:
Contribution Margin Per Unit = Revenue per unit − (COGS + Variable Order Costs + Allocated Ad Spend)
Contribution Margin % = (Contribution Margin Per Unit ÷ Revenue per unit) × 100
A 20% contribution margin is decent. A 40% contribution margin is excellent. Anything below 10% and you're probably unprofitable when you account for fixed overhead (rent, salaries, software, etc.).
Real Example: What This Looks Like in Practice
Let's walk through a worked example with a store that sells 40 SKUs across three categories: apparel, accessories, and home goods.
Here's what their product profitability looks like:
[IMAGE PLACEHOLDER: Product Profitability Table — 40 SKUs with COGS, variable costs, ad spend, return rate, contribution margin, and total units sold]
| Product | Category | Price | COGS | Variable Costs | Ad Cost/Unit | Return Rate | Contribution/Unit | Contribution % | Units Sold |
|---|---|---|---|---|---|---|---|---|---|
| Crew Neck Sweater | Apparel | $45 | $14 | $3.50 | $2.00 | 18% | $22.13 | 49% | 2,340 |
| Cotton T-Shirt | Apparel | $25 | $6 | $2.00 | $3.50 | 22% | $12.08 | 48% | 4,100 |
| Graphic Hoodie | Apparel | $55 | $18 | $4.00 | $8.50 | 25% | $20.10 | 37% | 1,890 |
| Denim Jacket | Apparel | $89 | $32 | $5.00 | $12.00 | 20% | $35.85 | 40% | 780 |
| Leather Belt | Accessories | $35 | $9 | $2.50 | $0 | 8% | $22.46 | 64% | 620 |
| Sunglasses | Accessories | $48 | $15 | $3.00 | $6.00 | 12% | $22.55 | 47% | 890 |
| Wool Beanie | Accessories | $22 | $5 | $1.50 | $1.50 | 6% | $13.81 | 63% | 3,210 |
| Canvas Tote Bag | Accessories | $32 | $7 | $2.00 | $5.50 | 9% | $16.17 | 51% | 450 |
| Ceramic Mug | Home Goods | $18 | $5 | $1.50 | $2.00 | 7% | $8.86 | 49% | 2,100 |
| Throw Pillow | Home Goods | $42 | $11 | $3.00 | $1.00 | 11% | $25.98 | 62% | 1,340 |
| Table Lamp | Home Goods | $95 | $35 | $4.50 | $4.00 | 14% | $48.43 | 51% | 220 |
| Bath Towel Set | Home Goods | $38 | $12 | $2.50 | $0.80 | 6% | $21.86 | 57% | 1,680 |
| ...and 28 more products... |
Look at what jumps out:
The Bestseller Trap: The Cotton T-Shirt sells 4,100 units (second highest volume) but has only a 48% contribution margin because it requires $3.50 in ad spend per unit.
The Margin Champion: The Leather Belt sells only 620 units but has a 64% contribution margin and $0 in ad spend. It's a pure organic seller.
The Silent Killer: Imagine a product that sells 2,000 units but has a 15% contribution margin. That's a low-margin workhorse. You're spending energy on volume that barely covers overhead.
The Unprofitable (Or Near It): Some products might show positive contribution margins but are actually underwater once you account for fixed costs (e.g., a product with 8% contribution margin can't cover its share of rent and salaries).
The point: revenue and profit are not the same thing. Not even close.
Track this automatically
Shopimize shows your real profit per order, per product, per channel.
Try Shopimize free →The "Hero Product" Trap: Why Your Best Seller Might Be Your Profit Killer
You've probably got a product that everyone knows about. Maybe it's on your homepage. Maybe it's your top seller by unit volume. Maybe you started the business with it.
It might also be killing your profit margins.
Here's why:
- You've discounted it repeatedly. Best sellers get promotional love. You've probably offered 15% off a dozen times, eroding margins.
- You're paying premium ad spend to keep it moving. Everyone already knows about it, so it takes more spend to maintain momentum.
- It attracts bargain hunters, not premium buyers. A product with 5,000 units sold is amazing—until you realize the return rate is 30% and the average customer is not buying anything else.
- It anchors your brand but doesn't anchor your profit. You keep it around because it's recognizable, not because it's profitable.
The antidote: look at the math. If your "hero" has a 15% margin, it's not a hero—it's a traffic driver. And you need to decide: is that its purpose? Or do you need to either price it up, reduce its ad spend, or cut it?
Actionable Next Steps: What to Do With Each Product
Once you've calculated contribution margins, here's the decision matrix:
[IMAGE PLACEHOLDER: Product Decision Matrix — 2x2 grid with Margin (High/Low) and Volume (High/Low)]
| High Volume | Low Volume | |
|---|---|---|
| High Margin (40%+) | Scale it. This is your profit engine. Increase ad spend, create bundles, make it a hero. | Nurture it. Low volume means you haven't found the right marketing angle yet. Test more channels, improve product page, consider influencer partnerships. |
| Low Margin (10-40%) | Optimize or exit. Can you raise price without losing volume? Reduce ad spend and let it become organic? Bundle it with a high-margin item? If not, discontinue. | Discontinue or bundle. Low volume + low margin = opportunity cost. Either bundle it with a high-margin product to increase perceived value, or kill it and reinvest the SKU complexity. |
For each product quadrant, here's the playbook:
High-Margin, High-Volume (Profit Engines)
- Action: Scale investment
- Increase ad spend—you can afford it
- Bundle with other products to increase basket size
- Create variants (colors, sizes) to capture more segments
- Use as a loss-leader occasionally (customer acquisition cost is worth it)
High-Margin, Low-Volume (Hidden Gems)
- Action: Invest in discovery
- These are margin champions. Why aren't they selling more?
- Test new ad channels (Pinterest, TikTok, YouTube)
- Improve product photography and description
- Partner with micro-influencers
- Create content around the product
- You might find a $5M product hiding here
Low-Margin, High-Volume (Workhorse Trap)
- Action: Optimize hard or kill
- Can you raise price 5–10% and hold volume? (Test it)
- Can you reduce ad spend and let it become organic?
- Can you reduce COGS by changing suppliers or negotiating?
- Can you bundle it with a high-margin item to improve the mix?
- If none of the above work, discontinue it. It's eating your margin.
Low-Margin, Low-Volume (Dead Weight)
- Action: Discontinue unless strategic
- This product is a distraction. It costs inventory management overhead and SKU complexity.
- The only exception: if it's a "new product" you're testing (give it 3-4 months)
- Or if it's a bundle component that serves high-margin products
- Otherwise: kill it and use the cash for products that actually work
Building Your Profit Dashboard
You don't need fancy software to do this calculation once. But if you want to do it monthly (you should), you need a system.
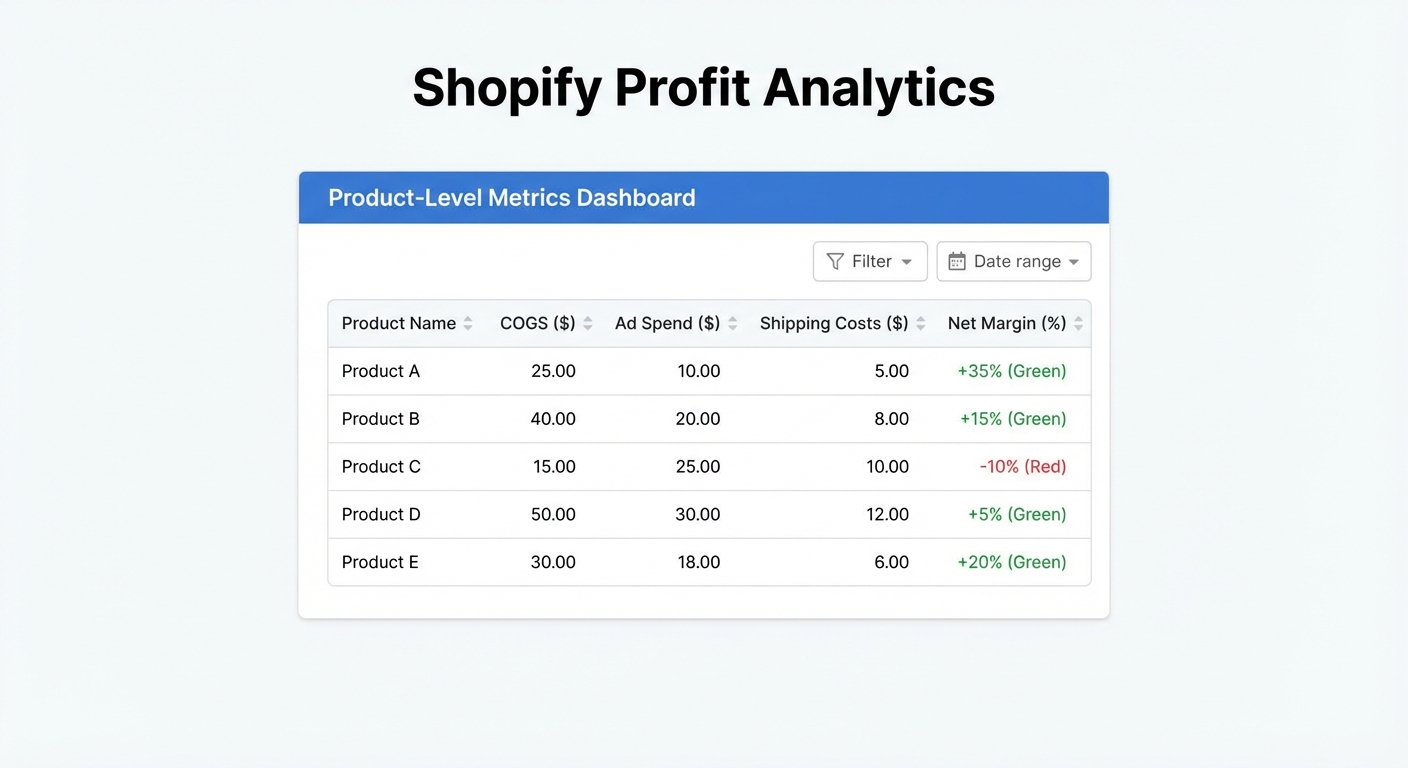
Options:
- Spreadsheet (Free): Export your data from Shopify, layer in COGS and ad spend manually, calculate margins. Labor-intensive but free.
- Custom SQL (Advanced): If you have developer resources, query your Shopify data alongside your accounting system to automate the calculation.
- SaaS Tools (Recommended): Use a tool built for this (like Shopimize) that automatically ingests Shopify data, lets you input COGS per product, and calculates contribution margins in real time. This is worth the cost if you have more than 20 SKUs.
Whichever you choose: do it monthly. Margins change when you raise prices, when suppliers change, when return rates shift. What was profitable in January might not be in March.
The Hard Truths
Calculating real profitability is uncomfortable because it usually reveals things you don't want to see:
- That bestseller that made you famous is barely profitable
- That product you're convinced will "grow into" profit never will
- That category you've invested 2 years building is low-margin
- That you've been celebrating revenue while margins quietly eroded
That discomfort is actually good. It means you've found the real leaks in your profit.
The alternative is staying in the dark, celebrating $500K in annual revenue while making $30K in actual profit. Which happens more often than you'd think.
FAQ
Q: Does this include fixed costs like rent and salaries?
A: No. Contribution margin is the money left after variable costs. Fixed costs are your overhead. Once you know contribution margin, divide your fixed costs by total units sold to see if you're actually profitable. If your monthly fixed costs are $10K and you sell 500 total units, you need $20 in contribution margin per unit just to break even.
Q: What's a "good" contribution margin?
A: 40%+ is excellent. 25-40% is healthy. 10-25% is tight. Below 10% is dangerous. But it depends on your industry and model. Grocery stores run 15-25% margins. Luxury fashion can run 60%+. Know your industry benchmark.
Q: Should I discontinue everything below 30%?
A: Not automatically. Low-margin products can still be valuable if they drive traffic, increase basket size, or reduce customer acquisition cost. But they shouldn't be your priority for investment.
Q: How often should I recalculate this?
A: Monthly at minimum. Quarterly as a backup. Your suppliers change, your ad costs change, your return rates shift. Margins drift fast.
Q: Can I include shipping revenue as offset to shipping costs?
A: No. Shipping revenue should reduce the effective cost to the customer, not offset your fulfillment costs. Keep them separate.
The Bottom Line
You already know that not all revenue is created equal. Now you have the framework to prove it.
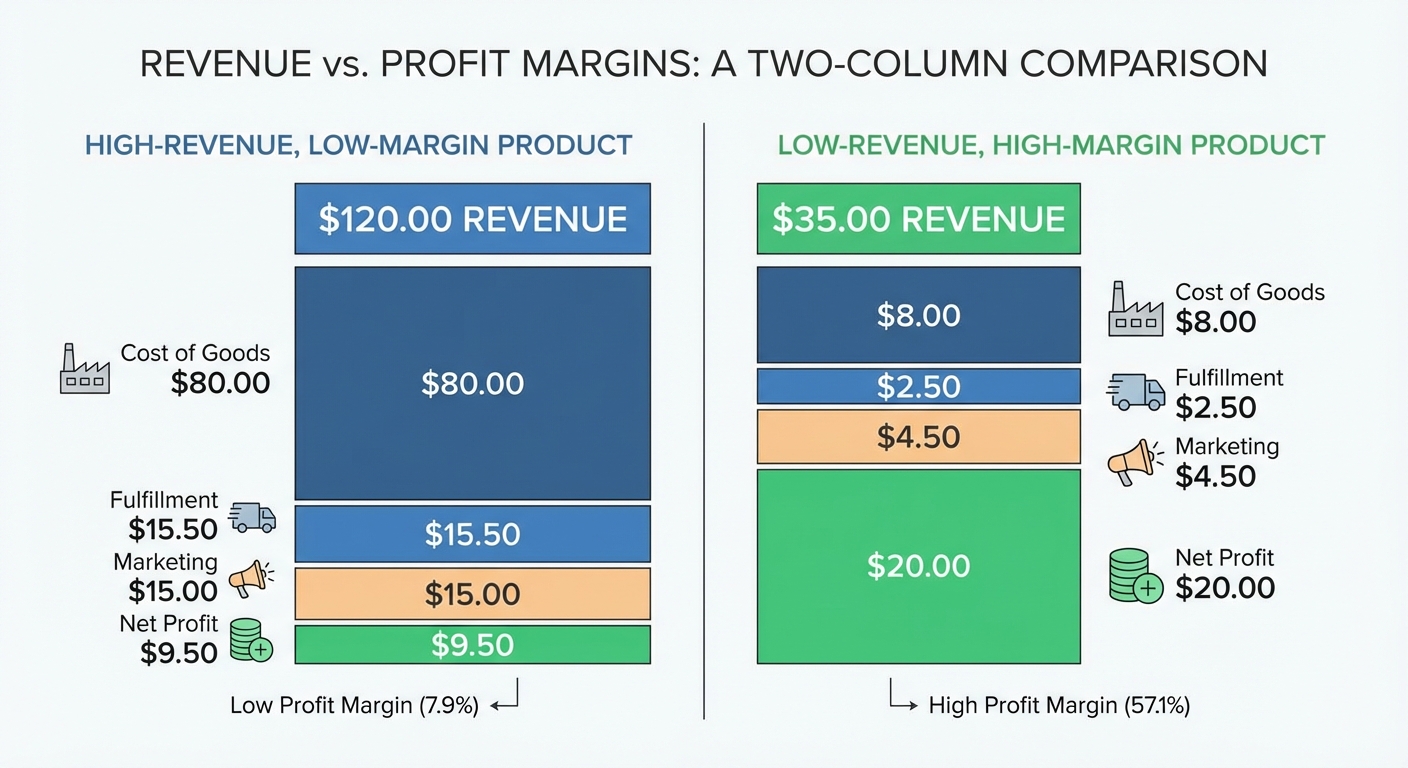
Your 20% profit-driving products are probably hiding in your data, unrecognized and under-invested. Your margin killers are probably getting marketing love they don't deserve.
The math takes a few hours. The decision making takes a conversation. The impact—that's months of better decisions, fewer wrong bets, and profit that actually shows up at the bottom line.
Start with your top 10 products. Run the numbers. I bet you'll be surprised.
Want to See Yours?
Calculating margins for 10 products is doable in a spreadsheet. Calculating them for 50+ products across channels, with real-time ad spend and return rate data, is a different story.
That's where product-level profit data becomes crucial.
Want to see which products actually make you money — and which ones don't? Try Shopimize free and get product-level profit data in minutes.
No credit card required. No commitment. Just the truth about your products.