
How to read your Shopify profit and loss (and act on it)
Most store owners check their Shopify dashboard and see revenue. Maybe a conversion rate. Perhaps the orders count from last night. What they rarely see — clearly, in one place — is whether any of that activity actually made them money.
That's the gap a Shopify profit and loss statement is designed to close. And once you know how to read one, it changes how you make every decision in your business.
This guide walks you through what a Shopify P&L actually includes, how to build a clear picture of your numbers, and — more importantly — what to do when those numbers tell you something you don't want to hear.
What is a profit and loss statement?
A profit and loss statement (P&L) is a financial summary that shows your revenue, costs, and resulting profit over a specific period — a week, a month, a quarter. It answers one question: after every expense is accounted for, how much money did you actually keep?
For Shopify merchants, that's harder to answer than it sounds. Revenue is easy to see. The costs — platform fees, transaction fees, ad spend, shipping, returns — are scattered across multiple platforms and invoices. A proper P&L pulls them all into one view.
Why your Shopify dashboard isn't a P&L
Shopify's built-in analytics are genuinely useful for tracking orders, sessions, and top products. But they're not a profit tool.
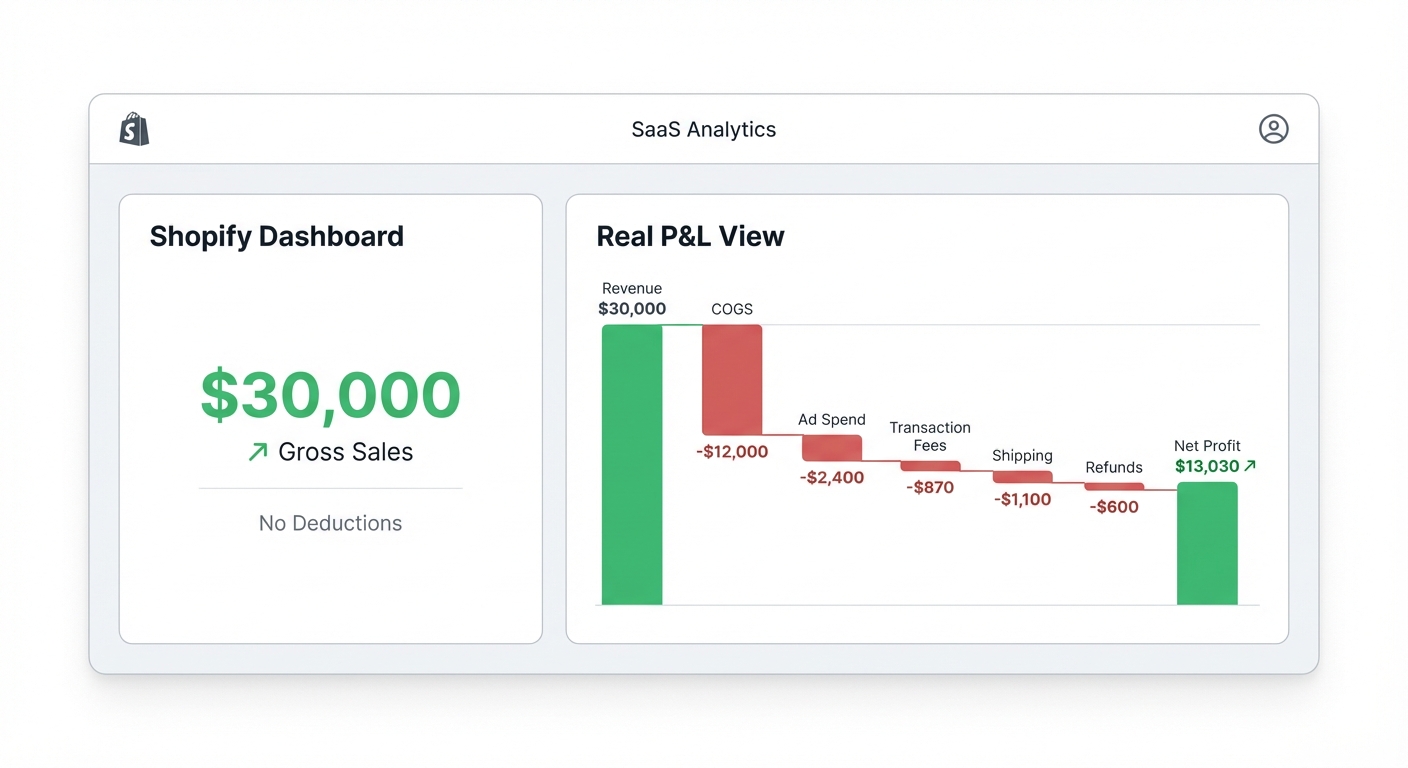
Here's why. Shopify shows you gross sales — the total value of orders placed. That number does not subtract:
- Cost of goods sold (COGS) — what you paid to source or manufacture the products
- Shopify subscription fees
- Shopify Payments transaction fees (2.9% + 30¢ for online orders on Basic)
- Shipping label costs
- Returns and refunds
- Ad spend from Meta, Google, or TikTok
A store doing $30,000 in monthly revenue might look healthy. But subtract $12,000 in COGS, $2,400 in ads, $870 in transaction fees, $1,100 in shipping, and $600 in refunds — and your actual profit is closer to $13,000. That's a 43% net margin, which is solid. But what if your COGS is higher, or your return rate spikes? The dashboard won't tell you. A P&L will.
The anatomy of a Shopify profit and loss statement
A complete Shopify P&L has four main layers. Every layer matters.
Layer 1: Gross revenue
This is your total sales before anything is subtracted — the number Shopify shows you prominently. It includes all completed orders at full price, minus any discounts applied at checkout.
Watch out for discounts here. A 20%-off sale that drives volume can quietly erode your margin if you're not tracking the impact carefully.
Layer 2: Cost of goods sold (COGS)
Cost of goods sold (COGS) is what you paid to produce or acquire the products you sold. For a Shopify merchant, this includes:
- Wholesale or supplier costs
- Manufacturing or production costs
- Inbound shipping from supplier to your warehouse (often missed)
- Packaging materials
COGS is subtracted from gross revenue to give you gross profit. This tells you how much money you made before operating costs. A healthy gross margin for a physical-product Shopify store typically sits between 40% and 70%, depending on category.
If you're a dropshipper paying $18 per unit and selling at $39.99, your gross margin is roughly 55%. Looks fine — until you factor in the next two layers.
Layer 3: Operating expenses
This is where most merchants lose visibility. Operating expenses for a Shopify store include:
- Platform and app fees — your Shopify subscription ($39/month on Basic, $105 on Shopify, $399 on Advanced) plus any apps you pay for monthly
- Transaction fees — Shopify Payments charges 2.9% + 30¢ per transaction on Basic; third-party processors add an extra 2% unless you use Shopify Payments
- Shipping costs — what you actually pay to fulfill and ship orders (not what you charge the customer)
- Ad spend — the total you've spent on paid channels, including Meta and Google
- Returns processing costs — restocking, return shipping you absorb, and any refund-related fees
Each of these has a direct impact on your bottom line, and none of them appear automatically in a Shopify P&L unless you put them there.
Layer 4: Net profit
Net profit is what's left after every expense — COGS and operating costs — is subtracted from gross revenue. This is the real number. The one that tells you whether your business is financially viable.
Net margin is that number expressed as a percentage of revenue. An 18% net margin means you keep $18 for every $100 in sales. For context, Shopify's own research and industry benchmarks suggest that 10-20% is a reasonable target for many product-based e-commerce businesses, though it varies significantly by category and business model.
Want to see your real numbers?
Try our free profit calculator — plug in your numbers and see your real net margin in 30 seconds.
Try the free calculator →How to build your Shopify P&L
You have a few options here, ranging from manual to automated.
Step 1: Pull your revenue and refunds from Shopify
In Shopify admin, go to Analytics > Reports > Finances summary. Export your sales, refunds, and discounts for the period you want to analyze. This is your starting point.
Step 2: Add your COGS
Shopify has a COGS field in the product settings, but it doesn't feed into any native reporting. You'll need to either maintain this in a spreadsheet or use a tool that tracks COGS against each order.
For a rough check: total units sold × average cost per unit. For more accuracy, you need per-SKU tracking, because your margins probably vary a lot by product.
Step 3: Calculate your Shopify fees
If you're on Shopify Payments, download your payouts report. Your transaction fees are deducted before you receive the payout, which means they're easy to miss. For the Basic plan, expect roughly 2.9% + 30¢ per transaction. On a $30,000 revenue month with an average order value of $60, that's approximately $1,020 in transaction fees alone.
Don't forget your monthly platform fee and any third-party app subscriptions. A $30/month inventory app and a $50/month review app are $960/year in overhead.
Step 4: Include your ad spend
Log into Meta Ads Manager and Google Ads, pull your total spend for the period, and add it to your cost column. This step alone surprises most merchants. It's common to track ROAS (return on ad spend) without ever connecting that spend back to overall profit.
A 3x ROAS sounds like a success. But if your net margin before ad spend is 25%, a 3x ROAS on a product sold at $50 with $15 in COGS means you spent roughly $5.50 per order in ads, and after fees and shipping, you're keeping about $4 per order. Not exactly building wealth.
Step 5: Account for shipping costs
Pull your actual shipping costs from whatever carrier or fulfillment setup you use — not the amount customers paid for shipping, but what you paid out. Free shipping offers are popular with customers and brutal for margins if not priced into the product correctly.
Step 6: Calculate your net profit
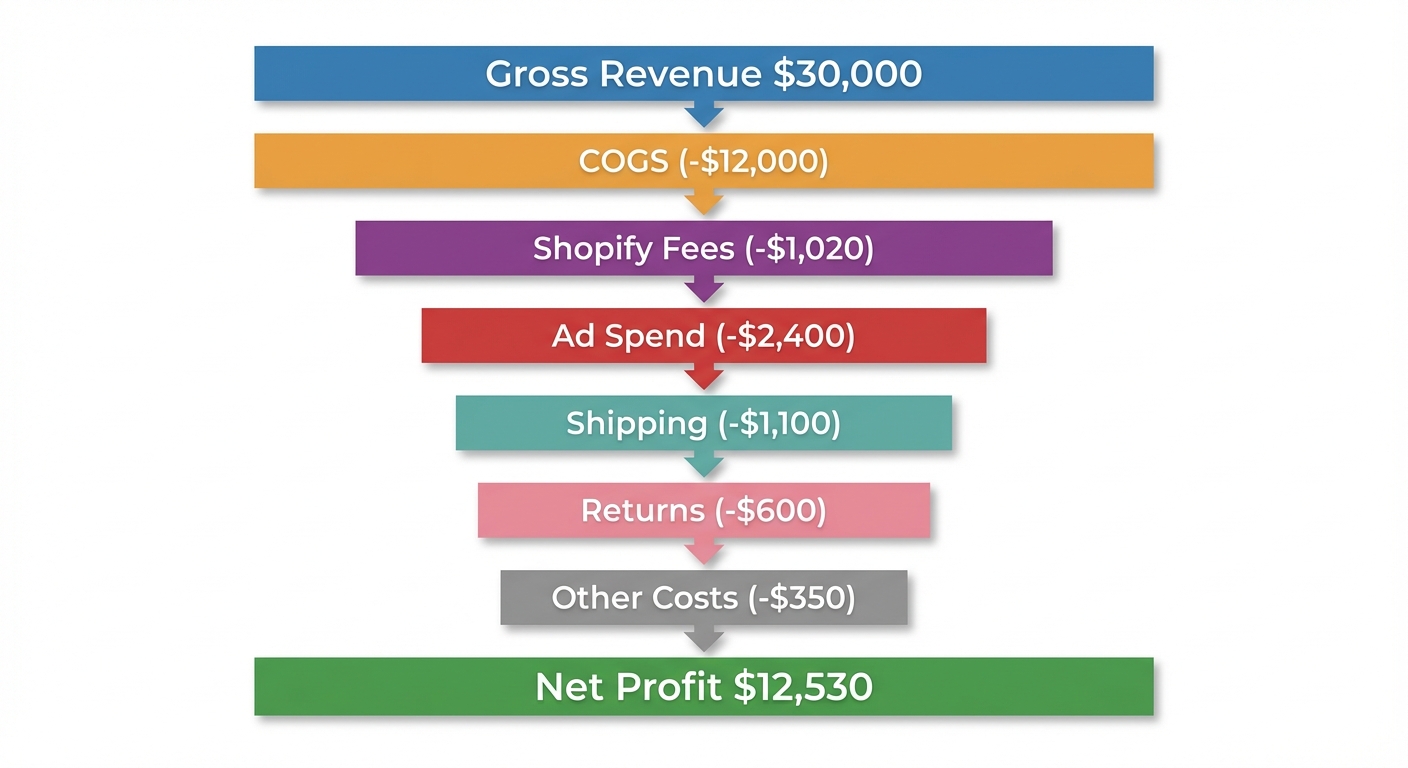
Now subtract everything from your gross revenue. The formula:
Net Profit = Gross Revenue − COGS − Shopify Fees − Ad Spend − Shipping − Returns − Other Costs
If you want to work through this yourself, our free profit calculator lets you plug in each line item and see your net profit and net margin instantly.
How to actually act on your P&L
Reading a P&L is step one. The real value comes from what you do with it.
Look at margin by product, not just overall
Your blended net margin might look fine — say, 22% — while hiding the fact that three products are being sold at a loss. This happens constantly. A low-ticket item with high return rates and expensive shipping might be actively costing you money while a mid-ticket product with strong margins carries the store.
Identify your two or three highest-margin products and your two or three lowest. That's where your attention should go first.
Set a monthly review rhythm
Review your Shopify profit and loss at the same time each month, before you make any significant spending decisions. Ad budget increases, new inventory orders, new app subscriptions — all of those decisions look different when you know your current net margin versus when you're just looking at revenue.
Watch the trend, not just the snapshot
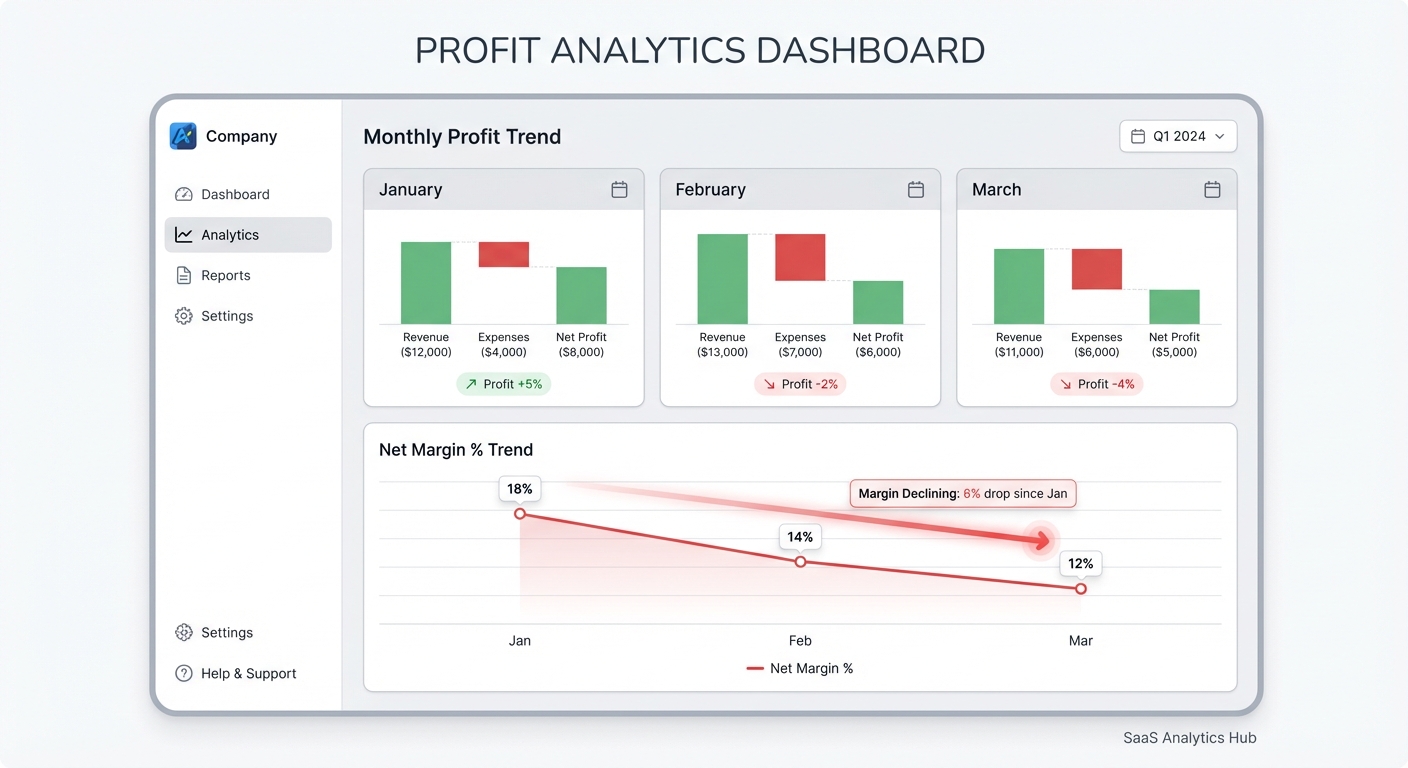
A single month's P&L is useful. Three months side-by-side tells a story. Are your transaction fees growing faster than revenue? Is shipping cost per order creeping up? Is your COGS ratio drifting higher because you switched suppliers?
Trends catch problems early. A single snapshot catches them late.
Use your P&L to pressure-test decisions
Before you run a sale, model what it does to your margin. If you discount 25% across your store and your gross margin is currently 48%, that promotion might push your net margin negative. You'd know that before spending on ads to promote it.
Before you hire a fulfillment center, add their per-order pick-and-pack cost to your P&L model and see what it does to profitability at current volume.
The manual P&L problem
Here's the honest challenge: building this manually in a spreadsheet every month takes time, it requires discipline, and it breaks the moment you forget to export a report or your ad spend data is a day behind.
Most store owners start with a spreadsheet, do it twice, and then stop doing it because it's too much friction.
The stores that maintain consistent profit visibility are the ones that either have a dedicated bookkeeper — which makes sense at higher revenue, but not for everyone — or use a tool that does this automatically.
Shopimize connects to your Shopify store and tracks your real profit automatically: COGS per product, Shopify fees, shipping costs, and more, all in one dashboard. Instead of building a P&L manually each month, you see your numbers updated in real time, with net margin broken down by product, order, and time period.
It's not about having more data. It's about seeing the right numbers without spending three hours pulling reports.
Your Shopify profit and loss is a decision-making tool
Revenue feels good. Profit is what pays you.
The merchants who build sustainable Shopify businesses aren't necessarily the ones with the highest revenue. They're the ones who know their numbers — who can tell you their net margin this month, which products are actually profitable, and what happens to their P&L if they raise ad spend by $500.
A Shopify profit and loss statement gives you that clarity. Once you have it, running the store gets simpler, not more complicated. You stop making decisions based on vibes and start making them based on what the numbers actually show.
FAQ
How do I find my profit and loss in Shopify?
Shopify's native admin doesn't have a dedicated P&L report. You can piece one together using the Finances Summary report (under Analytics > Reports) combined with a manual COGS spreadsheet and exported ad spend data. For a complete, automated view, you'll need a profit analytics tool like Shopimize that combines all your cost data in one place.
What's a good net margin for a Shopify store?
It depends on your category, but a general benchmark is 10–20% net margin for product-based e-commerce stores. Apparel and accessories tend to run leaner due to return rates; digital products or high-ticket items often see higher margins. The most important thing is knowing your own number so you can track whether it's improving or declining over time.
What's the difference between gross profit and net profit on Shopify?
Gross profit is your revenue minus the cost of goods sold (COGS) — it tells you how much you made on the products themselves before operating expenses. Net profit subtracts everything else: platform fees, transaction fees, ad spend, shipping, and returns. Net profit is the number that tells you whether your business actually made money. Many merchants have strong gross margins but thin or negative net margins once all costs are counted.
Do I need accounting software to track my Shopify P&L?
Not necessarily. Dedicated accounting software like QuickBooks is valuable for tax filing and formal bookkeeping, but for day-to-day profit visibility — understanding which products make money, whether your margins are healthy, and how your costs are trending — a purpose-built Shopify profit analytics tool is often faster and more actionable.