
E-commerce Profit Margins by Industry: What's Normal in 2026
You've watched your margins compress. You've raised prices, optimized shipping, ruthlessly cut waste. But you still wonder: Are we where we should be?
That question matters more in 2026 than ever before. Rising ad costs, inflation in logistics, return pressure, and the rapid adoption of AI-driven operations have created a genuinely different margin landscape than even 2024.
Here's the thing: there's no single "healthy" profit margin for e-commerce. A 5% net margin is crushing it in groceries. It's barely viable in fashion. And in luxury goods, your competitors might be targeting 30%+.
This article cuts through the noise. We've compiled real 2026 industry data, broken down 12 major e-commerce categories, explained what moves the needle on margins in each, and given you a framework to benchmark your own performance. Let's dig in.
The Big Picture: Margins Under Pressure in 2026
Before we zoom into specific industries, understand the macro forces reshaping margins right now:
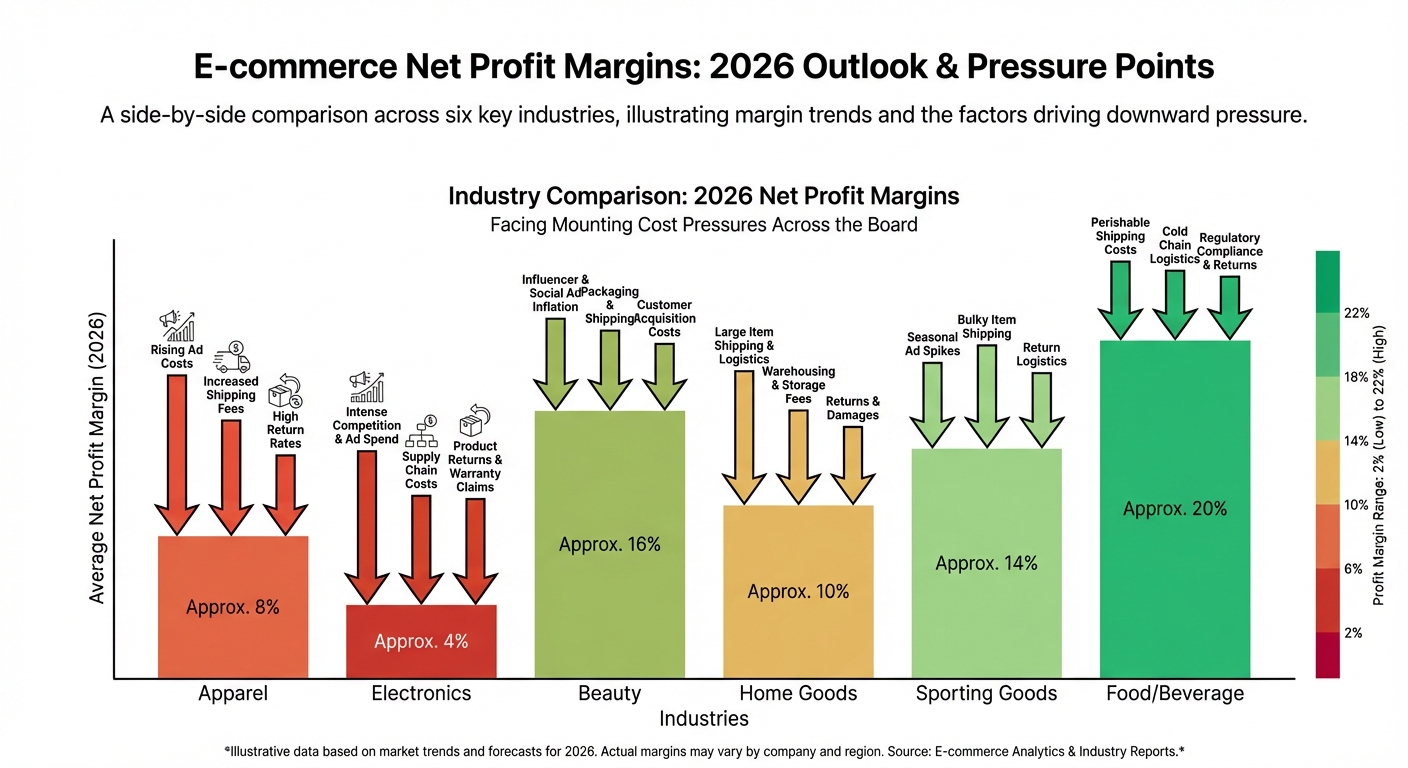
Rising customer acquisition costs. Meta's cost per click has climbed steadily. Google's CPC is up 12-18% year-over-year in most competitive verticals. For many sellers, customer acquisition as a percentage of gross profit has crept from 8% to 14% in just two years.
Shipping complexity. Carrier rates stabilized after the 2023-2024 spikes, but regional surcharges, dimensional weight pricing, and returns logistics are eating into margins. Expect shipping costs to consume 12-20% of revenue in most categories (versus 8-10% five years ago).
Return rates climbing. Fashion and electronics still see the highest return rates (25-35%), but it's trending up across the board. Processing, restocking, and liquidation of returned inventory now costs smart sellers 2-4% of net revenue.
AI adoption as a margin multiplier. The winners in 2026 aren't the biggest sellers; they're the ones using AI to optimize pricing, inventory, and operations. Companies that leverage AI for demand forecasting, dynamic pricing, and supply chain efficiency are seeing 2-5 percentage point margin improvement versus peers.
Regulatory headwinds. Labor laws around shipping, changes to sales tax collection, and international duties are adding friction and cost, especially for smaller merchants.
Despite these pressures, data shows that well-run e-commerce businesses are actually finding margin improvements—not through magic, but through precision. The separation between mediocre and excellent operators has widened.
Industry-by-Industry Breakdown: 2026 Margins & Dynamics
Here's what healthy margins look like in 12 major e-commerce categories. Use these as a north star, but remember: your specific mix (brand vs. commodity, DTC vs. marketplace, premium vs. budget) will shift these ranges.
Margin Benchmarks Table
| Industry | Typical Gross Margin | Typical Net Margin | Key Dynamic |
|---|---|---|---|
| Fashion & Apparel | 45–65% | 5–12% | Rising returns, seasonal inventory risk |
| Beauty & Personal Care | 50–70% | 8–15% | Competitive pricing, high repeat rate |
| Health & Supplements | 40–65% | 6–14% | Regulatory costs, Amazon competition |
| Electronics | 20–40% | 2–8% | Price competition, warranty costs |
| Food & Grocery | 20–35% | 1–4% | Shipping complexity, perishability |
| Home & Furniture | 35–55% | 4–10% | Heavy logistics, high returns |
| Jewelry | 50–80% | 10–25% | Brand leverage, smaller volume |
| Sports & Outdoor | 40–60% | 5–12% | Seasonal swings, niche positioning |
| Toys & Games | 35–55% | 3–8% | Retailer competition, inventory risk |
| Automotive Parts | 30–50% | 4–10% | Complex SKU management, technical support |
| Pet Supplies | 40–60% | 6–12% | Subscription opportunity, loyal customers |
| Luxury Goods | 55–85% | 15–40% | Low volume, brand pricing power |
[IMAGE PLACEHOLDER: Chart showing margin comparison across industries with gross vs. net breakdown]
Where the Money Goes: Cost Allocation by Industry
Understanding margins is easier when you see how revenue actually splits. Here's a realistic breakdown of how a typical $100 in revenue gets allocated across six major cost buckets, by industry:
Cost Allocation Breakdown
| Industry | COGS | Shipping | Ads/Marketing | Payment & Platform Fees | Operations | Net Profit |
|---|---|---|---|---|---|---|
| Fashion & Apparel | 45% | 8% | 12% | 5% | 8% | 8–15% |
| Beauty & Personal Care | 35% | 7% | 10% | 4% | 6% | 12–15% |
| Health & Supplements | 40% | 6% | 12% | 4% | 8% | 8–10% |
| Electronics | 75% | 9% | 6% | 3% | 4% | 3–5% |
| Food & Grocery | 70% | 12% | 4% | 3% | 4% | 2–4% |
| Home & Furniture | 55% | 15% | 8% | 4% | 8% | 5–10% |
| Jewelry | 30% | 5% | 12% | 4% | 4% | 15–20% |
| Sports & Outdoor | 40% | 8% | 10% | 4% | 6% | 10–12% |
| Toys & Games | 50% | 8% | 10% | 4% | 7% | 5–10% |
| Automotive Parts | 55% | 6% | 7% | 4% | 6% | 8–12% |
| Pet Supplies | 45% | 7% | 8% | 4% | 6% | 12–14% |
| Luxury Goods | 25% | 4% | 8% | 3% | 5% | 25–35% |
Note: These are median allocations based on 2026 data. Outliers exist; your mix depends on your business model, channel mix, and operational maturity.
[IMAGE PLACEHOLDER: Stacked bar chart showing cost allocation by industry]
Want to see your real numbers?
Try our free profit calculator — plug in your numbers and see your real net margin in 30 seconds.
Try the free calculator →The Deep Dives: Industry-Specific Margin Realities
Fashion & Apparel
Gross margin: 45–65% | Net margin: 5–12%
Fashion remains the largest e-commerce category, but it's brutal on margins. Your cost of goods might be 40%, but returns eat 3–4% of revenue, ad costs run 10–15%, and you're battling Amazon's logistics advantage on every channel.
The margin winners in fashion aren't competing on price. They're winning through vertical integration (owning production or design), building direct-to-consumer moats with brand loyalty, and optimizing for repeat customers. Brands with high customer lifetime value can absorb higher acquisition costs.
2026 trend: Micro-segmentation. Successful fashion sellers are using AI to personalize product recommendations and minimize overstock. Liquidation costs used to hit like a hammer; AI-driven demand forecasting is cutting that by 15–20% for leaders. Additionally, reshoring of manufacturing (especially in the US) is tightening gross margins slightly but improving inventory agility.
Beauty & Personal Care
Gross margin: 50–70% | Net margin: 8–15%
Beauty is the sweet spot. Higher gross margins (thanks to premium pricing and brand power), but lower shipping costs per unit, and excellent repeat rates. A customer who buys skincare once often buys again—reducing your customer acquisition burden.
The margin leaders in this category leverage subscription models, bundling, and education-driven content marketing to reduce reliance on expensive paid ads. A $200 customer lifetime value in beauty is achievable; in electronics, you're lucky to hit $400 across five years.
2026 trend: Marketplace fatigue is pushing merchants back to DTC. Amazon takes 45% off the top (FBA fees + commission); beauty brands are building owned channels and seeing net margins improve by 3–6 percentage points.
Health & Supplements
Gross margin: 40–65% | Net margin: 6–14%
Supplements occupy an odd position: consumers buy online (great for margins), but the category faces intense Amazon competition and regulatory overhead. Supplement claims must be carefully monitored; marketing costs are higher to build trust around efficacy and safety.
The margin advantage goes to brands with clinical backing, third-party testing, and strong educational content. Retailers selling commodity multi-vitamins are squeezed; creators of niche formulas (keto supplements, sleep aids, targeted micronutrient blends) hold better margins.
2026 trend: Regulatory tightening around supplement claims is increasing compliance costs, especially for international sellers. Expect net margins to compress by 1–2 points for sellers without strong legal infrastructure. Conversely, subscription models for daily-use supplements are seeing strong adoption—margins improve when you lock in predictable revenue.
Electronics
Gross margin: 20–40% | Net margin: 2–8%
Electronics is unforgiving. You're competing globally on price, warranty costs are real, and returns are high (15–30% in many categories). A $500 laptop sale might carry a 25% gross margin—but after shipping, refunds, support, and ads, you're left with $15.
The winners in electronics are specialists, not generalists. They build expertise in specific product lines (gaming peripherals, smart home, mobile accessories), develop direct relationships with manufacturers, and create communities that reduce marketing cost. They also leverage logistics advantage—maybe they warehouse regionally and save 15–20% on shipping versus pure dropshippers.
2026 trend: Refurbished and renewed electronics are eating into new product margins, but for smart sellers, this is an opportunity. Refurbished margins run 5–8 percentage points higher. Additionally, AI-driven pricing tools are helping sellers navigate the highly dynamic pricing in electronics, preventing margin-killing race-to-the-bottom competition.
Food & Grocery
Gross margin: 20–35% | Net margin: 1–4%
Food is the margin graveyard. Perishability, high shipping costs, regulatory overhead, and thin gross margins create an environment where a 3% net margin is genuinely excellent. You're competing with Walmart, Amazon Fresh, and local grocery stores.
The players who survive are either specialized (farmers' markets selling direct, niche organic boxes, ethnic specialty foods) or they've built sustainable logistics. Cold chain shipping is expensive—but if you operate regional hubs and batch orders, you compress that cost.
2026 trend: Meal kit and subscription models are stabilizing after years of turmoil. Recurring revenue lets you optimize logistics and reduce marketing cost per customer. Non-perishable specialty foods (international, artisanal, diet-specific) maintain higher margins because they avoid the shipping cost burden of fresh goods.
Home & Furniture
Gross margin: 35–55% | Net margin: 4–10%
Furniture is heavy, pricey, and complex. Shipping costs run high (15–20% of order value for large items), returns are common, and customers expect free shipping. Yet gross margins can be solid if you're not just importing commodity pieces—design, customization, and quality matter.
The margin leaders in this category own their logistics. They work with regional fulfillment partners or white-glove delivery services, bundle shipping into slightly higher MSRPs, and minimize returns through detailed product information, sizing guides, and customer reviews. Customizable furniture (modular, personalized) also commands higher gross margins and lower returns.
2026 trend: 3D visualization and AR try-on features are reducing returns significantly—and margins are following. Sellers investing in visual tech are seeing 2–4% improvement in net margins as return rates drop. Also, made-to-order and dropship logistics for larger items are becoming more viable, reducing inventory risk.
Jewelry
Gross margin: 50–80% | Net margin: 10–25%
Jewelry is one of e-commerce's hidden margin havens. High perceived value, low shipping weight, strong brand leverage, and lower return rates create an environment where 20% net margins are achievable and not unusual. Customers spend more time deciding, and impulse purchases are rare—but when they buy, they buy.
The margin spread is wide because it depends heavily on positioning. Mass-market fashion jewelry runs 50–60% gross, 8–12% net. Designer and luxury jewelry can run 70–80% gross, 20–30% net. The difference is brand power and customer acquisition strategy.
2026 trend: Lab-grown diamonds and ethical positioning are opening new margin segments. Consumers are willing to pay premium prices for transparency and sustainability, and these narratives reduce reliance on pure performance marketing.
Sports & Outdoor
Gross margin: 40–60% | Net margin: 5–12%
Sports and outdoor goods sit between fashion and electronics in margin dynamics. Seasonal swings are brutal (ski season, summer camping season), but successful players use this to their advantage. They've learned to forecast and position inventory to capture margin uplift during peak seasons.
Direct-to-consumer brands in this space (selling primarily their own products) see higher margins than retailers or marketplaces. A kayak or tent brand selling direct can hit 40% net margins; the same retailer selling 20 brands might see 8% net margins.
2026 trend: Community-driven DTC is the winning formula. Brands building loyal communities (climbers, cyclists, hikers) reduce marketing spend by 40–50% through word-of-mouth and user-generated content. This drives net margins up significantly.
Toys & Games
Gross margin: 35–55% | Net margin: 3–8%
Toys face inventory risk and retailer competition. Big Box stores still own this space, but e-commerce is taking share through niche specialization and licensing deals. The margin challenge: you're competing with Amazon on popular items while trying to stock unique, differentiated toys to avoid pure price competition.
Licensed goods (Disney, Marvel, anime) carry stronger margins because they reduce direct comparison. Wooden toys, educational toys, and subscription boxes are higher-margin niches.
2026 trend: Educational positioning and STEM toys are higher-margin categories; parents perceive value and aren't as price-sensitive. Sellers bundling toys with subscription services (monthly surprises, curated collections) are seeing 6–8% net margins versus 3–5% for pure sell-through models.
Automotive Parts
Gross margin: 30–50% | Net margin: 4–10%
Auto parts is a specialist's game. Margins are solid for players with expertise—because margins depend on solving the right problem for the right vehicle. A generic parts retailer competes on price and sees 4–6% net margins. A specialist seller building a community around vehicle modification or maintaining a catalog of exact-fit parts for specific makes sees 8–12%.
Technical support and fitment consultation add value and justify margin. Returns are lower (customers know what they're buying), and repeat rates are strong.
2026 trend: OEM (original equipment manufacturer) margin compression is pushing more margin-focused sellers toward aftermarket and performance parts. Additionally, EV adoption is reshaping SKU demand—winners are repositioning inventory ahead of this shift.
Pet Supplies
Gross margin: 40–60% | Net margin: 6–12%
Pet supplies is a margin-friendly category. Pets are a non-discretionary expense (owners will prioritize pet needs), repeat purchases are frequent, and customer loyalty is high. Subscription models work wonderfully here because owners reorder the same food and supplies monthly.
The margin leaders leverage subscriptions heavily. A 20% discount for auto-ship drives repeat revenue, which reduces marketing cost per customer by 50%+ over a year. Net margins for subscription-heavy sellers run 10–15%.
2026 trend: Personalization (customized pet food, tailored supplement plans) is driving premium positioning and higher margins. Sellers using pet health data and breed-specific recommendations are commanding 10–15% price premiums.
Luxury Goods
Gross margin: 55–85% | Net margin: 15–40%
Luxury is a different sport. Margins are the highest in e-commerce because brand power, scarcity, and service expectations create an entirely different economics. Customers aren't price-shopping; they're seeking experience and exclusivity.
The luxury winners control the narrative. They invest in content, customer service, and brand heritage. A $5,000 watch or handbag might be purchased once per customer, but the perceived value and brand loyalty drive organic word-of-mouth. Customer acquisition cost is lower as a percentage of transaction value.
2026 trend: Experiential luxury and authentication are reshaping margins. Sellers offering virtual try-ons, personalized consultations, or exclusive previews are building brand moats. Authentication (proving authenticity of resold luxury) is also becoming a trust lever and margin justifier.
How to Benchmark Your Own Margins: A Framework
Knowing that jewelry should run 20% net margins doesn't help if you don't know where your business sits. Here's a practical framework:
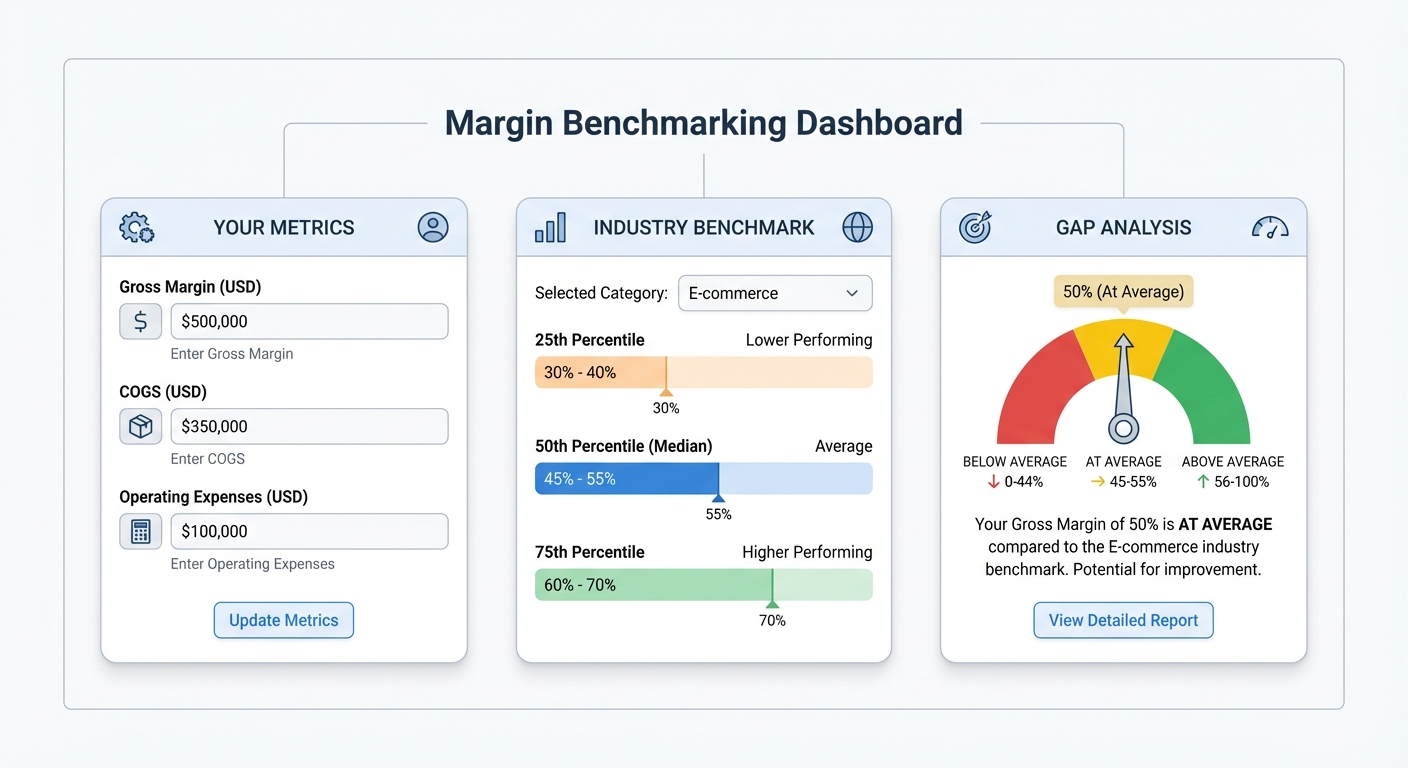
1. Calculate Your Actual Numbers
Pull three months of data:
- Gross Profit % = (Revenue – COGS) / Revenue
- Operating Expense % = (Total Operating Expenses) / Revenue
- Net Profit % = (Net Income) / Revenue
Include all operating expenses: ads, shipping, payment processing, fulfillment labor, customer service, tools, compliance, returns processing. Don't exclude things because they're "variable" or "temporary."
2. Segment by Channel
If you sell on Shopify and Amazon, compare them separately. Amazon's take-rate is brutal; your net margin there will be 3–5 points lower than direct. This is expected—it's the cost of their traffic. DTC should be your margin north star.
3. Adjust for Your Positioning
If you're a premium brand, your gross margins should run higher than the industry baseline. If you're competing on price, they should be lower—but only if you've optimized operations to hit the lower range efficiently.
If your margins are below the low end of your industry range, investigate:
- COGS: Are you buying at competitive prices? Can you negotiate better terms?
- Ads: What's your customer acquisition cost as a percentage of gross profit? Is it running high?
- Shipping: Are you optimizing carrier selection and packaging?
- Returns: Are returns running high? Can product detail, reviews, or sizing guides reduce them?
- Inefficiency: Are you paying for tools, services, or labor that don't drive revenue?
4. Benchmark Year-Over-Year
Don't just compare to industry averages. Compare your Q2 2026 to your Q2 2025. Are margins compressing or improving? Understand why.
The AI Margin Multiplier: 2026 Changes Everything
This year, AI adoption is creating a genuine margin divide.
Sellers using AI for:
- Dynamic pricing: Adjusting prices based on demand, competition, and inventory age are capturing 1–3 percentage points of margin improvement.
- Demand forecasting: Reducing overstock and liquidation by 15–25% is worth 0.5–2 percentage points of margin improvement.
- Content generation: Reducing time spent on product descriptions, ads, and emails is cutting marketing overhead by 10–20%.
- Customer segmentation: Targeting high-value customers with efficient campaigns reduces ad waste by 15–30%.
The margin winners in 2026 aren't necessarily the biggest businesses. They're the ones leveraging AI to operate smarter.
FAQ
What's considered a "healthy" e-commerce net margin?
It depends on your industry. For electronics, 4–6% is healthy. For luxury, 20%+ is healthy. Use the table above for your category. As a general rule: if your net margin is in the bottom quartile of your industry range and you're not a strategic price-leader, margins are too thin.
Should I prioritize growing revenue or improving margins?
Early growth phase? Focus on revenue and market share. Established business? Margin optimization compounds. Year 5+ should lean heavily on margin improvement because growth slows and profitability becomes the survival metric.
How much does returns really cost?
More than you think. A 20% return rate on a $100 item with a 50% gross margin looks like this:
- Revenue: $100
- Gross Profit: $50
- 20% of orders returned, restocking at 50% value: -$10 cost
- Net impact: -2% of gross profit
Reducing returns from 20% to 15% just moved 1 percentage point to your bottom line.
Is it worth optimizing for a 1–2% margin improvement?
Yes. For a $1M annual revenue business at 8% margins, a 1-point improvement = $10K more profit. At $10M revenue, it's $100K. Margin compounding compounds hard.
Why are my margins lower than the table suggests?
Possible reasons:
- You're overweighting low-margin channels (Amazon vs. DTC).
- COGS is uncompetitive; you need better supplier relationships.
- Ad costs are high; your targeting or conversion rate needs work.
- Returns are running high; product quality or descriptions need attention.
- You're on platforms with high fees; moving some volume to owned channels helps.
Should I raise prices to improve margins?
Carefully. Price elasticity varies by category. Raising prices in commoditized electronics by 5% might lose 20% of customers. Raising prices on specialty items by 5% might lose 3%. Test small and measure customer response.
How do seasonal swings affect margin targets?
Q4 typically runs 2–4 points higher margins due to volume and brand spending. Plan accordingly. Don't judge your business on Q4 margins; benchmark on your baseline quarters (Feb, August, October).
The Bottom Line
Your profit margins aren't arbitrary. They're shaped by your industry, your positioning, your operational maturity, and increasingly, your technology adoption.
The data is clear: the margin winners in 2026 aren't the biggest sellers. They're the ones who know their numbers, benchmark honestly against their category, and relentlessly optimize the levers within their control.
Start with the table above. Find your industry. Honest question: where do you sit relative to that range? If you're below it, pick one lever (COGS, ads, returns, shipping) and improve it by 10%. That single optimization might move your margin 0.5–1 percentage point.
Multiply that across 12 months and a few operational tweaks, and you've just fundamentally changed your business economics.
Want to see where your margins sit relative to your industry — automatically, with real data? Try Shopimize free and benchmark your profitability in minutes.