
How to Build a Real P&L for Your Shopify Store
Most Shopify store owners know one number: revenue. Maybe two, if they're tracking profit from their accounting software.
But here's the truth—that revenue number is a vanity metric. It tells you what customers paid, not what your business actually earned. And most e-commerce owners don't have a real P&L (profit and loss statement) to show the difference.
A real P&L forces you to face the truth: all the costs that sit between revenue and actual profit. Ad spend. Shipping. Payment processing. Returns. Refunds. Shopify plan fees. Packaging materials. That contractor you hired.
Without it, you're flying blind.
This guide walks you through building a complete, honest P&L for your Shopify store. You'll see exactly where money comes in and where it goes out. And you'll finally understand whether you're actually making money.
What Is a P&L, and Why Your Shopify Store Needs One
A profit and loss statement (P&L) is a financial snapshot that answers one question: What did my business actually earn?
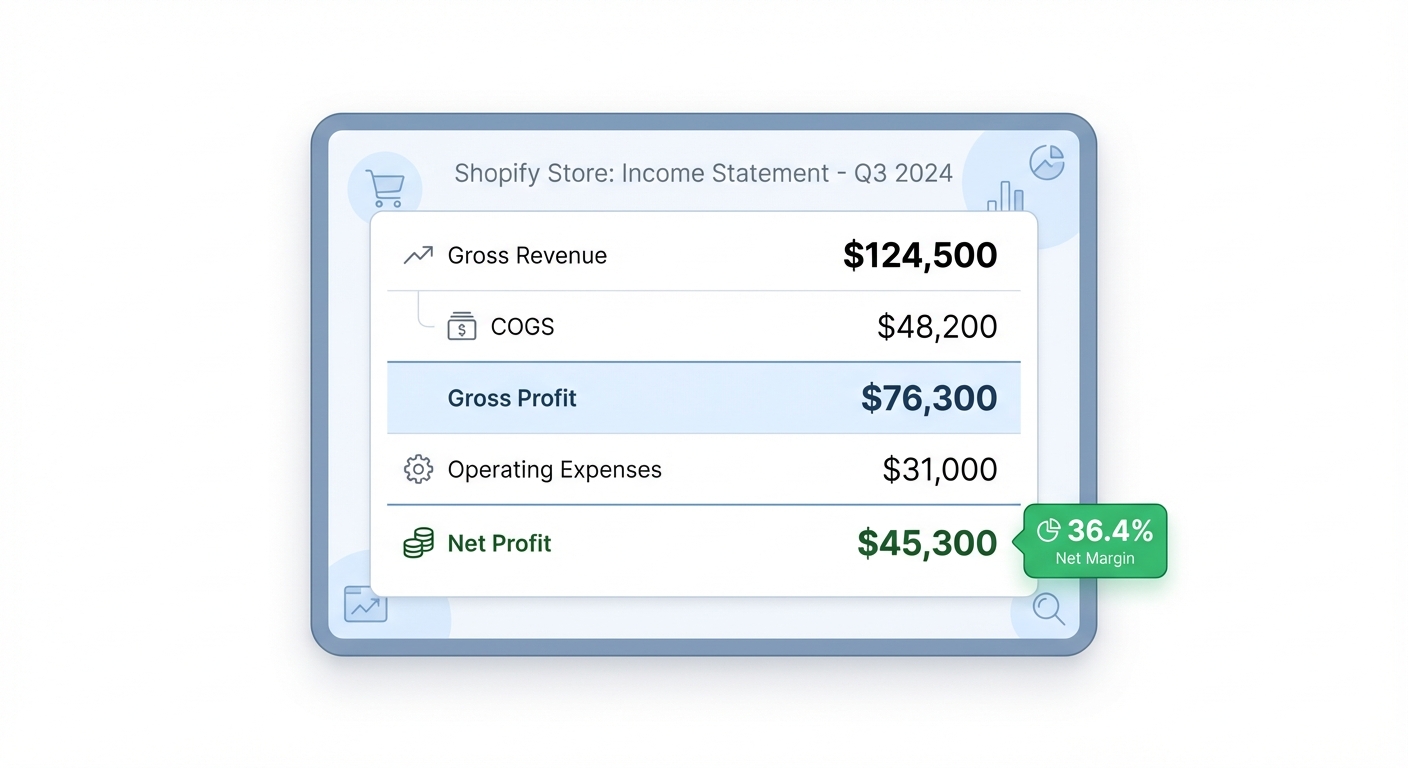
It's structured in layers:
- Revenue — What customers paid you
- Minus COGS — What it cost to make or buy the product
- Gross Profit — What's left to run the business
- Minus Operating Expenses — What it costs to keep the doors open (ads, labor, software)
- Net Operating Profit — Profit from core business operations
- Minus Other Expenses — Taxes, interest, one-time costs
- Net Profit — The real bottom line
Most Shopify store owners skip this. They see $50K in monthly revenue and celebrate. They don't see the $18K in ads, $8K in returns, $6K in shipping, and $4K in subscription fees that comes out of it.
You can't optimize what you don't measure. And you can't build a sustainable business without a real P&L.
The Complete E-Commerce P&L Structure
Here's the framework every Shopify store should use:
| Line Item | Amount | % of Revenue |
|---|---|---|
| REVENUE | ||
| Gross Sales | $43,200 | 101.4% |
| Discounts & Promotions | ($800) | -1.9% |
| Returns & Refunds | ($1,400) | -3.3% |
| Net Revenue | $41,000 | 100.0% |
| COST OF GOODS SOLD | ||
| Product Cost | $16,400 | 40.0% |
| Inbound Shipping (wholesale) | $820 | 2.0% |
| Total COGS | $17,220 | 42.0% |
| GROSS PROFIT | $23,780 | 58.0% |
| OPERATING EXPENSES | ||
| Paid Advertising (Facebook, Google, TikTok) | $14,350 | 35.0% |
| Payment Processing Fees | $2,050 | 5.0% |
| Shopify Plan & Apps | $450 | 1.1% |
| Shipping & Fulfillment | $5,740 | 14.0% |
| Packaging Materials | $410 | 1.0% |
| Customer Service Labor | $1,500 | 3.7% |
| Tools & Software (email, analytics, etc.) | $600 | 1.5% |
| Total Operating Expenses | $25,100 | 61.2% |
| Net Operating Profit | ($1,320) | -3.2% |
| OTHER EXPENSES | ||
| Taxes (estimated quarterly) | $500 | 1.2% |
| TOTAL OTHER EXPENSES | $500 | 1.2% |
| NET PROFIT (LOSS) | ($1,820) | -4.4% |
This is a real P&L. And it tells a story you won't see in your Shopify dashboard.
This store has $41K in net revenue. Revenue that looks healthy. But after paying for products, ads, shipping, processing fees, and labor, it's losing $1,820 per month.
That's a loss. And without this P&L, the owner would never see it.
A Worked Example: The Accessories Brand
Let's walk through a real scenario. Meet Sarah's accessories brand. She sells handmade jewelry, scarves, and bags through her Shopify store.
Here's her monthly snapshot (March 2026):
[IMAGE PLACEHOLDER: Screenshot of Shopify admin Orders page showing $43,200 in gross revenue]
Step 1: Calculate Net Revenue
Sarah's Shopify dashboard shows:
- Gross sales: $43,200
- Discounts given: $800
- Returns/refunds processed: $1,400
Net Revenue = $43,200 - $800 - $1,400 = $41,000
She finds this in Shopify by going to: Analytics → Orders → all reports. The orders section shows total sales, but she needs to manually add up returns from Orders → Returned orders.
Step 2: Determine COGS
Sarah manufactures some items and dropships others.
- Handmade items cost her $8 each in materials (labor included)
- Dropshipped items cost her $6 on average
- She sold 900 units total: 600 handmade + 300 dropshipped
- Handmade COGS: 600 × $8 = $4,800
- Dropshipped COGS: 300 × $6 = $1,800
- Inbound shipping to her studio: $820 (for wholesale stock)
Total COGS = $4,800 + $1,800 + $820 = $7,420
Wait—in the table above, COGS was $17,220. That's because she carries more inventory than one month's sales. She tracks average cost per unit sold based on her current inventory cost, not what she paid for it in the past. This is important for accuracy.
Step 3: Calculate Gross Profit
Gross Profit = $41,000 - $17,220 = $23,780
This is the money available to run the business. It's 58% of revenue—which is healthy for e-commerce.
Step 4: Add Up Operating Expenses
Sarah tracks:
- Paid Ads (Facebook & Instagram): $14,350/month (she tracks this in her Meta ads manager and reconciles with her bank statement)
- Payment Processing Fees: Shopify Payments charges 2.9% + $0.30 per transaction. She calculates: ($43,200 × 2.9%) + (1,200 transactions × $0.30) = $1,253 + $360 = $1,613. She also has a small amount of PayPal sales that cost 2.2%. Total: $2,050
- Shopify Plan: She's on the Shopify plan ($29/month), plus apps: Printful integration ($25/month), inventory tracker ($75/month), email marketing integration ($125/month). Total: $254
- Shipping & Fulfillment: For orders she fulfills herself, she pays $3–5 per package. For dropshipped orders, Printful charges. She calculates her average shipping cost per order at $4.79 × 1,200 orders = $5,748. But that's before she adjusts for returns and free shipping offers. Net: $5,740
- Packaging Materials: Custom branded boxes, tissue, thank-you cards. She buys in bulk at $0.34 per order = $408
- Customer Service Labor: She spends 15 hours/week answering emails and messages. At $25/hour, that's $1,500/month
- Tools & Software: Slack ($10/month), Google Analytics ($0/free), Canva Pro ($120/year), subscription to industry news, etc. Total: $600/month
Total Operating Expenses = $14,350 + $2,050 + $254 + $5,740 + $408 + $1,500 + $600 = $24,902
(The table shows $25,100 because she also factors in $198 for supplies and miscellaneous. Let's call it $25,100 for rounding.)
Step 5: Calculate Net Operating Profit
Net Operating Profit = $23,780 - $25,100 = -$1,320
Ouch. She's spending more to run the business than she's earning from sales.
Step 6: Account for Other Expenses & Taxes
Sarah sets aside money for estimated quarterly taxes: about $500/month.
Net Profit = -$1,320 - $500 = -$1,820
She's losing $1,820/month.
Want to see your real numbers?
Try our free profit calculator — plug in your numbers and see your real net margin in 30 seconds.
Try the free calculator →Where to Find Each P&L Line Item in Shopify
You don't need fancy accounting software to build a P&L. Shopify itself contains most of what you need.
Revenue
- Gross Sales: Shopify admin → Analytics → Reports → Orders (or use Shopify Gross Sales report)
- Discounts: Orders → Discounts (or filter orders by discount applied)
- Returns/Refunds: Orders → Returned orders, or Shopify Gross Sales report (shows refunds separately)
COGS
- Product costs: You need to track this yourself or use an inventory app. Shopify doesn't track cost of goods automatically. Set up a spreadsheet or use apps like Inventory Lab or Shopify's standard cost field (if available in your plan).
Operating Expenses
- Ads spend: Meta Ads Manager, Google Ads, TikTok Ads Manager (export to spreadsheet)
- Payment processing: Shopify Payments settlement reports (Shopify admin → Finances → Payouts) show fee breakdowns
- Shopify plan & apps: Shopify admin → Settings → Plan & permissions (shows plan cost) and → Apps & integrations (shows app charges)
- Shipping: ShipStation, Printful, or your fulfillment partner's reporting (or use Shopify's Shipping & fulfillment reports)
- Packaging: Track via supplier invoices or accounting software
- Labor: Spreadsheet or timekeeping tool (Toggl, Harvest)
- Other tools: Subscription invoices sent to email
The Spreadsheet Method vs. Automated Tools
Spreadsheet Pros:
- Free
- You understand every cell
- Flexible (build it exactly how you want)
- No learning curve for simple P&Ls
Spreadsheet Cons:
- Manual data entry (error-prone)
- No automation (you update it manually each month)
- Fragmented data (pulling from 6+ different sources)
- Easy to miss numbers (returns, processing fees, app costs)
- No real-time visibility
- Doesn't update as sales change
Automated Tools Pros:
- Real-time P&L updates (as sales come in)
- All data in one place
- Less manual work
- Fewer errors
- Historical tracking (see trends month-to-month)
- Built for e-commerce (knows where to find your data)
Automated Tools Cons:
- Subscription cost ($29–$300/month depending on the tool)
- Requires connection to Shopify & payment processor
- May not capture every custom cost
The honest take: If you're doing under $10K/month, a spreadsheet works. Once you hit $10K+, the manual work becomes more than it's worth, and the cost of an automated tool becomes negligible compared to the insight you gain.
Common P&L Mistakes (and How to Avoid Them)
1. Mixing Personal and Business Expenses
Your car insurance, groceries, and internet bill aren't business expenses. If you work from home, only deduct a portion of your internet. This confuses profit calculations and creates tax problems.
Fix: Keep business and personal finances completely separate. Use a business bank account. Be ruthless about what goes in the P&L.
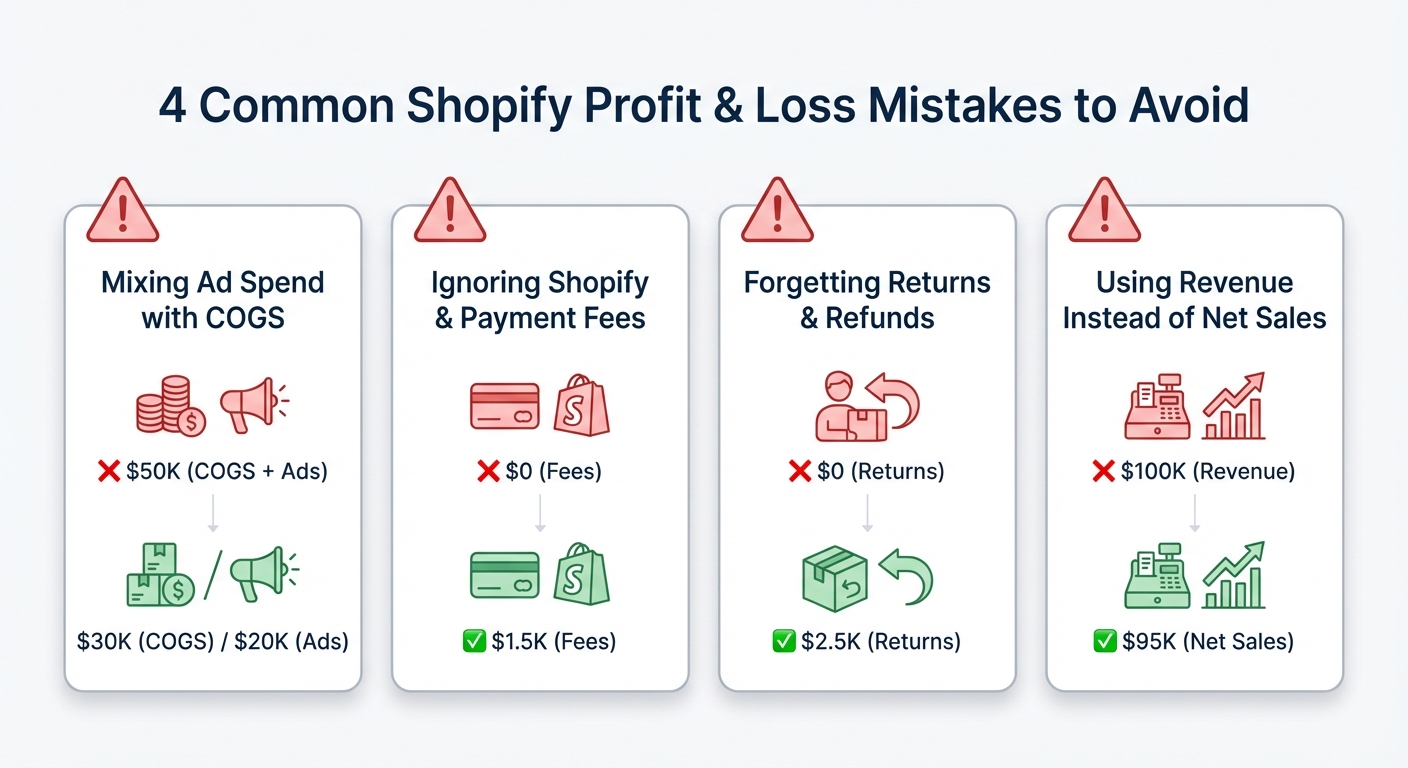
2. Forgetting Returns and Refunds
You deduct them from revenue. If you ignore them, your P&L looks 3–5% better than it really is. Over a year, that's thousands of dollars of invisible loss.
Fix: Pull your refund report monthly from Shopify and subtract it from gross sales.
3. Double-Counting Payment Processing Fees
Some store owners subtract payment fees from revenue. Some add them as an operating expense. Both are right (they net the same), but mixing the two in one month confuses everything.
Fix: Pick one method and stick with it. Most common: leave revenue alone and list payment processing as an operating expense.
4. Using Accrual vs. Cash Accounting Without Consistency
Accrual: Record revenue when the order ships, not when you get paid. Record expenses when you're invoiced, not when you pay.
Cash: Record revenue when money hits your bank, expenses when you pay the bill.
Most small e-commerce businesses use cash accounting. But inconsistency ruins your P&L.
Fix: Choose one method, document it, and stick with it every month.
5. Ignoring Inventory Write-Downs
If you have $10K in dead stock sitting in your garage that you'll never sell, that's a loss. It doesn't disappear because you ignore it.
Fix: Quarterly, review inventory. Anything unsellable gets marked down and subtracted from COGS.
How a Real P&L Changes Your Decisions
Sarah's P&L showed a loss. Here's what changed:
Before P&L: "I made $43K in sales. I feel successful. Why am I broke?"
After P&L: "I see the problem. I'm spending 35% of revenue on ads and 14% on shipping. And customer service labor is consuming $1,500/month. Here's what I'm going to do:"
- Optimize ad spend. She looked at her Facebook pixel data and cut spend on audiences with high ad cost per purchase. Result: ads drop from 35% to 28% of revenue.
- Renegotiate shipping. She switched from individual carrier rates to a negotiated USPS contract through her fulfillment partner. Shipping drops from 14% to 10%.
- Automate customer service. She built a FAQ page and set up automated email responses for common questions. Labor drops from $1,500 to $700/month.
By the next month, she's profitable. The P&L made that possible because you can't optimize what you don't measure.
How Often Should You Review Your P&L?
Weekly: Quick pulse check (just revenue, ad spend, gross margin). Takes 10 minutes. Helps you spot problems early.
Monthly: Full P&L. All line items. Trend analysis. This is the decision-making P&L. Do this on the 1st or 2nd of the next month while the previous month is fresh.
Quarterly: Review tax obligations, seasonal trends, and year-to-date trajectory. This feeds into planning.
Annually: Full audit with your accountant. Compare to prior year. Plan next year's goals.
Most successful store owners run a monthly P&L without fail. They know it's the difference between guessing and knowing.
FAQ
What if I don't know my COGS?
You need to figure it out. Calculate the average material or wholesale cost per unit you sold. If you use multiple suppliers, average them. This is non-negotiable—without COGS, your P&L is incomplete. If you're dropshipping, your COGS is whatever you pay the supplier. If you're manufacturing, it's materials + labor.
Should I include my own salary as a business expense?
Yes. Your time has a cost. If you're not paying yourself, your P&L is lying. Even if you don't take a formal salary, estimate what you'd pay someone to do your job and include it as "owner compensation" or "labor." This forces you to see whether the business is actually profitable after paying for work done.
What's a healthy gross margin?
For physical products:
- Dropshipping: 40–60% (simple product, high mark-up)
- Manufactured goods: 50–70% (you control costs, can optimize)
- Low-margin goods: 20–40% (commodity products, high volume)
For software/digital products: 70–95%.
If your gross margin is below 40%, you're relying on volume. That's fine, but it's fragile.
How do I account for inventory sitting in my warehouse?
Inventory is an asset, not an expense. You don't deduct it from revenue unless it's damaged or unsellable. However, you do track the cost of goods as you sell them (COGS). If you buy $10K of inventory and sell $5K worth, you only deduct the cost of the $5K sold from revenue.
Can I use my personal credit card expenses in my P&L?
Yes, if they're business expenses. But reconcile them carefully. Pull a statement and categorize each charge. This is where most people go wrong—they include personal stuff and confuse profitability.
What if my P&L shows a loss every month? When should I be concerned?
If your P&L shows a loss every month, you're either:
- In an early growth phase (acceptable for up to 6–12 months)
- Spending more than you're earning (not sustainable)
- Not charging enough (need to raise prices or reduce costs)
- In a competitive market (may need a different business model)
A loss for 3+ months in a row is a red flag. Start optimizing immediately: cut ad spend with poor ROI, raise prices, reduce operating costs, or reassess the business model.
Bringing It Together
A real P&L is the difference between running a business and hoping you're running a business.
It forces you to:
- Know where money comes from
- See where it goes
- Make informed decisions
- Stop leaving thousands on the table
Most Shopify store owners don't have one. That's their advantage—and yours.
If you're willing to build a real P&L each month, you'll make better decisions than 90% of your competitors. You'll see profit leaks early. You'll know whether to scale or tighten. You'll sleep better at night.
Start with this month. Go back and gather the numbers. It'll take a few hours. Next month, it'll take 30 minutes. And after that, you'll have the clearest picture of your business possible.
Your business—and your bank account—will thank you.
Want a real-time P&L that updates automatically — no spreadsheets, no manual data entry? Try Shopimize free and see your true profit and loss in minutes.