
What a Shopify Profitability Audit Actually Reveals
Most Shopify store owners discover their real profit situation the same way — by accident. A slow month forces them to look closer at the numbers, and suddenly they're seeing things that were always there, just never laid out in one place. Returns eating 8% of revenue. Shopify fees they'd never totaled up. Ad spend that looked efficient by ROAS but was quietly draining margin.
A Shopify profitability audit is the deliberate version of that moment. Instead of waiting for a bad month to force the question, you go looking for the answer yourself.
Here's what that process actually looks like — and what most merchants find when they do it for the first time.
What is a Shopify profitability audit?
A Shopify profitability audit is a structured review of every cost flowing through your store, compared against your revenue, to calculate your true net profit. It goes beyond your Shopify dashboard's revenue total and accounts for cost of goods sold (COGS), platform fees, payment processing, shipping, ad spend, and returns — all the things that sit between a sale and actual money in your pocket.
Think of it as a financial health check. You're not just asking "how much did I sell?" but "how much did I actually keep?"
Why your Shopify dashboard isn't enough
Shopify's built-in analytics are genuinely useful for tracking orders, traffic, and sales trends. But they're not built to show you profit. Your dashboard shows revenue. That number feels good. It's supposed to.
The problem is that for most stores, the gap between revenue and real profit is larger than owners expect — and it's made up of costs that are easy to overlook individually, but add up to something significant.
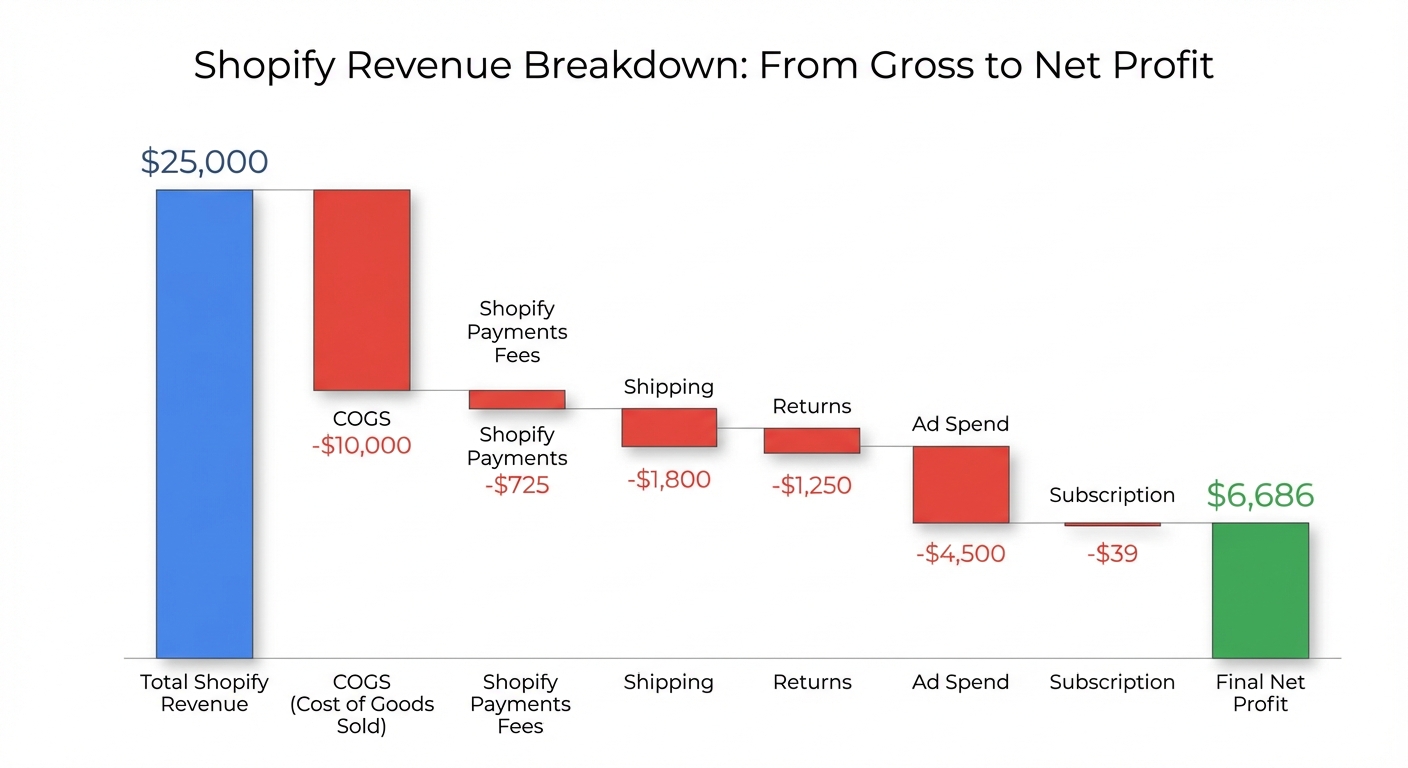
Here's a quick illustration. Say your store did $25,000 in revenue last month. That's a milestone worth celebrating. But:
- COGS: $10,000 (40% of revenue)
- Shopify Payments fees: ~$725 (2.9% + $0.30 per transaction, ~500 orders)
- Shipping costs: $1,800
- Returns and refunds: $1,250
- Facebook and Google ads: $4,500
- Shopify subscription (Basic plan): $39
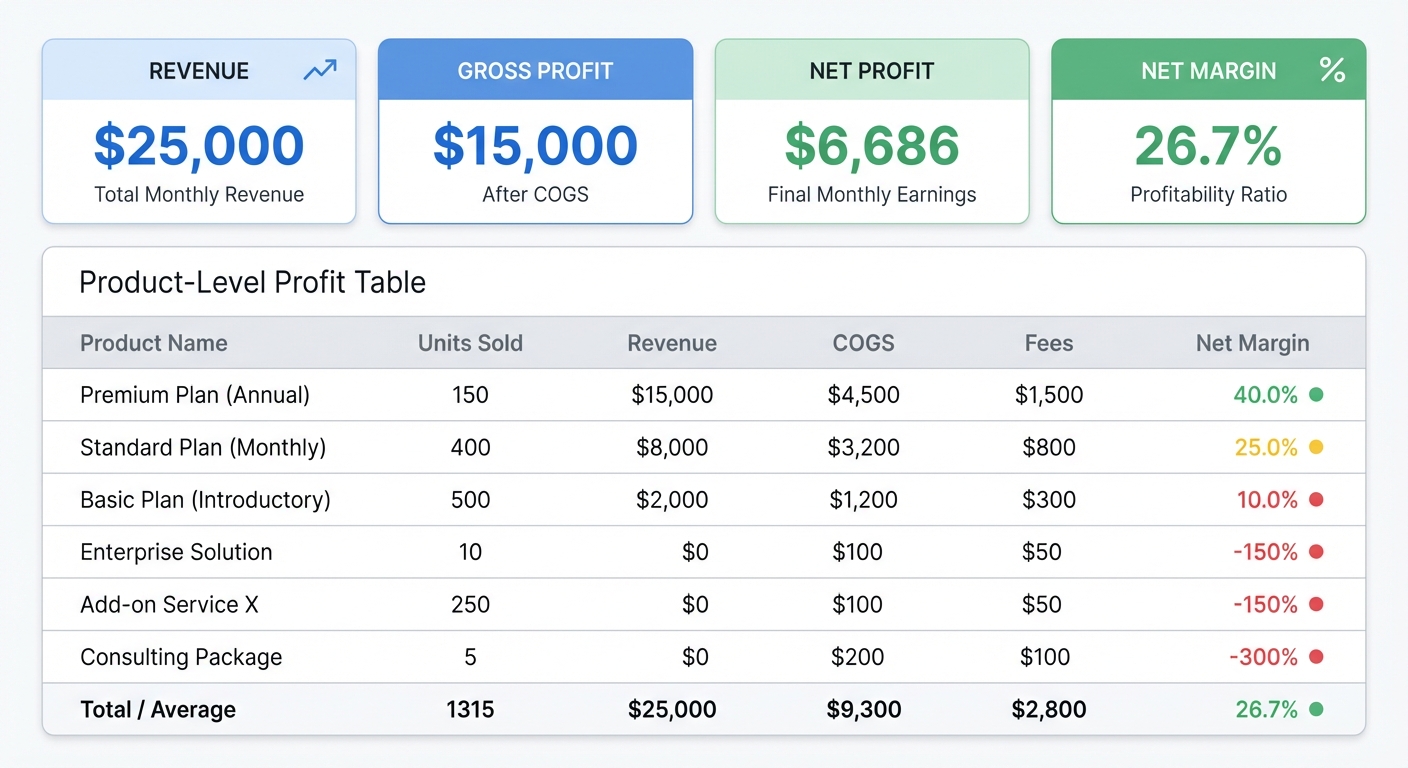
What's left: $6,686 — a 26.7% net margin
That's not a bad result. But it's also very different from $25,000. And plenty of stores run the same math and end up under 10%.
What a profitability audit actually looks at
1. Cost of goods sold (COGS)
This is the most important number most stores aren't tracking properly. COGS is what you paid to acquire or produce the products you sold — including supplier cost, manufacturing, and any inbound freight.
If you're not entering COGS in Shopify (or in a third-party tool), every gross margin calculation you run is wrong. Full stop.
Many merchants use a blended COGS estimate across their catalog, which is better than nothing but still misses product-level variation. A proper audit maps COGS to individual products or variants, so you can actually see which items are contributing margin and which are dragging it down.
2. Shopify fees and payment processing costs
Shopify's transaction and processing fees vary by plan and payment method. On Shopify Basic with Shopify Payments, you're paying 2.9% + $0.30 per online transaction. That's $725 on 500 orders averaging $50 each. On 1,000 orders at the same average, you're over $1,400 — before you add the monthly plan fee.
These numbers are in your Shopify billing section, but most merchants have never added them up across a full month or quarter. The audit forces you to.
You can find a full breakdown of current Shopify plan pricing directly on Shopify's pricing page.
3. Shipping costs
Shipping is a category where the math gets complicated fast. Offering free shipping is often the right move for conversion, but it's a cost that comes directly out of your margin.
If you're absorbing shipping on a $35 order with a $14 COGS and charging nothing, your margin is getting squeezed from both ends. An audit calculates your actual shipping spend — what you paid carriers, not what you charged customers — and shows you the real per-order impact.
4. Returns and refunds
Returns are probably the most underestimated cost in e-commerce. They're not just the revenue reversal. There's also:
- The cost of the original shipping (usually not recovered)
- Return shipping costs if you cover them
- Processing time or restocking fees
- Inventory that may be unsellable or needs remarking
A 10% return rate on $25,000 in revenue isn't a $2,500 problem. Once you account for all the associated costs, it's likely closer to $3,500–$4,000.
5. Ad spend and true ROAS
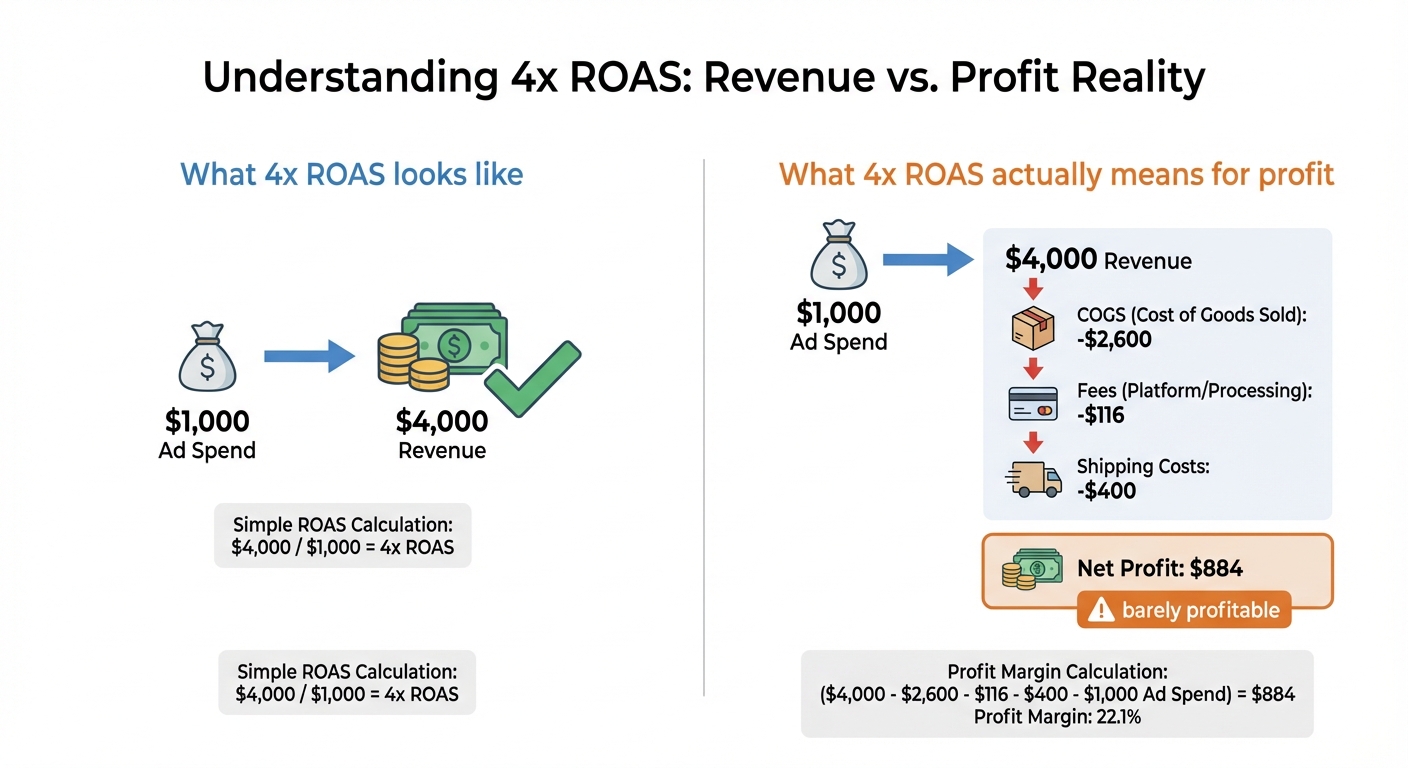
This is where a lot of merchants get into trouble. A 3x or 4x ROAS looks solid on the surface. But ROAS only tells you the ratio of ad revenue to ad spend — it doesn't tell you if that revenue was profitable.
If you're running Facebook ads at a 4x ROAS but your gross margin on those products is 35%, you're barely breaking even. The math: at 4x ROAS, for every $1 in ad spend you're generating $4 in revenue. But after COGS (35% margin leaves 65% in costs), you're spending $1 to make $1.40 in gross profit — before Shopify fees, shipping, and overhead.
That's not a winning campaign. An audit surfaces this by connecting ad spend data to actual margin, not just revenue.
Track this automatically
Shopimize shows your real profit per order, per product, per channel.
Try Shopimize free →The five things merchants most commonly find
Doing this audit with dozens of stores, we've seen the same patterns show up again and again.
1. Products they thought were bestsellers are actually loss leaders. High volume, low margin, high return rate. They drive revenue but destroy profit. Once you see it on paper, the fix is usually straightforward — raise prices, cut the SKU, or tighten the ad targeting.
2. Their effective Shopify fee rate is higher than they realized. When you combine subscription costs, transaction fees, and app subscriptions (some merchants are paying $200–$400/month in apps), the platform overhead adds up to 4–6% of revenue in some cases.
3. Free shipping thresholds are set too low. A merchant offering free shipping on orders over $35 might have an average shipping cost of $7.50. On a $35 order with a 40% gross margin, that shipping cost wipes out roughly half their margin. Raising the threshold to $50 or $60 often has minimal impact on conversion and meaningful impact on profit.
4. Their best-margin products aren't getting the ad spend. When ad campaigns are optimized for volume or ROAS rather than margin, budget tends to flow toward high-revenue products — not necessarily high-profit ones. An audit identifies which products deserve more investment.
5. Returns are concentrated in a few products or SKUs. Return rates aren't evenly distributed. Usually it's one or two products with sizing issues, quality problems, or misleading listings driving the majority of returns. Fix those, and the impact on margin is immediate.
How to do a Shopify profitability audit in 15 minutes
You don't need an accountant or a spreadsheet with 40 tabs. Here's the practical process:
Step 1: Pull your revenue total for the period you're auditing (last 30 days is usually the right starting point).
Step 2: Calculate your COGS for the same period. If you haven't been tracking this, use a weighted average cost across your top-selling products.
Step 3: Pull your Shopify billing — subscription fee, transaction fees, and any app charges. Add them up.
Step 4: Pull your actual shipping spend — what you paid carriers, not what customers paid you.
Step 5: Pull your returns and refunds total from Shopify analytics, and add an estimated 20–30% on top for associated costs.
Step 6: Pull your ad spend across all platforms for the same period.
Step 7: Subtract everything from revenue. What's left is your net profit for the period.
That number is the one that matters. You can plug your own numbers into our free profit calculator to run this calculation quickly without building a spreadsheet.
The goal isn't perfection on the first pass. It's getting a real number in front of you — because most merchants find that the exercise itself surfaces at least one significant problem they can act on immediately.
What changes after you run the numbers
The merchants who do this regularly — once a month, minimum — tend to make better decisions. Not because they're smarter, but because they're working from accurate information.
They raise prices on low-margin products with less hesitation, because they can see the math. They cut ad spend on campaigns that look profitable but aren't. They adjust free shipping thresholds based on actual cost data. They prioritize the products that are genuinely building their business, not just inflating their revenue figure.
There's also something psychological that happens when you see your real profit number clearly. The anxiety of "I'm not sure if this is actually working" gets replaced by something more actionable — either confidence or a specific problem to fix.
The difference between a one-time audit and ongoing visibility
A one-time audit is valuable. It gives you a snapshot, and it usually reveals at least a few things you can fix right now.
But the real leverage comes from having this visibility continuously — seeing your net margin week over week, watching how a price change or a new ad campaign affects your actual profit, not just your revenue.
The stores that consistently improve their margins aren't doing a big audit once a year. They're tracking profit the same way they track revenue — as a regular, visible number.
What a Shopify profitability audit really tells you
Here's the honest answer: it tells you whether your store is actually working.
Revenue is a leading indicator. It tells you people are buying. But a Shopify profitability audit tells you whether that buying is building something, or just generating activity. There's a big difference between a $25,000/month store with a 28% net margin and one with a 6% net margin. Same revenue, very different businesses.
Running this audit — and running it regularly — is the fastest way to stop guessing and start managing your store like the business it is.
Shopimize is built to make this process automatic. Instead of pulling numbers from five different places and manually calculating margin, you get your true profit — accounting for COGS, all Shopify fees, ad spend, shipping, and returns — updated in real time. It's the audit, done continuously.
Frequently asked questions
How often should I run a Shopify profitability audit?
At minimum, once a month — ideally aligned with the end of your billing cycle so all fee data is current. Many merchants find that reviewing key profit metrics weekly helps them catch problems earlier and make faster decisions on ad spend and pricing.
Does Shopify show net profit natively?
No. Shopify's analytics show revenue, refunds, and some cost data if you've entered COGS manually, but there's no built-in view that combines COGS, Shopify fees, shipping, ad spend, and returns into a single net profit number. You either calculate it manually or use a profit analytics tool.
What's a good net margin for a Shopify store?
It depends heavily on your category, but as a general benchmark, a net margin of 15–25% is healthy for most product-based Shopify stores. Below 10% leaves very little buffer for growth or unexpected costs. Above 30% is strong and usually indicates well-managed COGS and controlled ad spend. You can find industry-specific benchmarks in our Shopify profit margin by niche guide.
What's the difference between gross profit and net profit for a Shopify store?
Gross profit is revenue minus COGS only. Net profit subtracts everything else — fees, shipping, ad spend, returns, and overhead. Gross profit tells you if your product pricing makes sense. Net profit tells you if your business model makes sense. Both numbers matter, but net profit is the one that tells you how much you're actually keeping.