
Shopify Analytics: What It Shows, What It Misses, and What to Do About It
You log into Shopify, pull up your analytics dashboard, and see that beautiful curve trending up. Revenue's climbing. Your conversion rate looks solid. Traffic's steady. Everything feels good.
Then you check your bank account and wonder where the money went.
This isn't your imagination. Shopify's native analytics are genuinely great at one thing: showing you what sold and where the traffic came from. They're not great at showing you what actually makes money. That's not a flaw—it's just not what Shopify set out to do. They're a commerce platform. Analytics is a feature, not their main business.
But if you're trying to run a profitable shop, that distinction matters.
Let's walk through what Shopify analytics does well, where they leave you blind, and what you need to fill those gaps.
[IMAGE PLACEHOLDER: Dashboard with green revenue numbers, but blurred out cost columns]
What Shopify Analytics Gets Right
Before we talk about gaps, let's be fair. Shopify's analytics dashboard does these things really well:
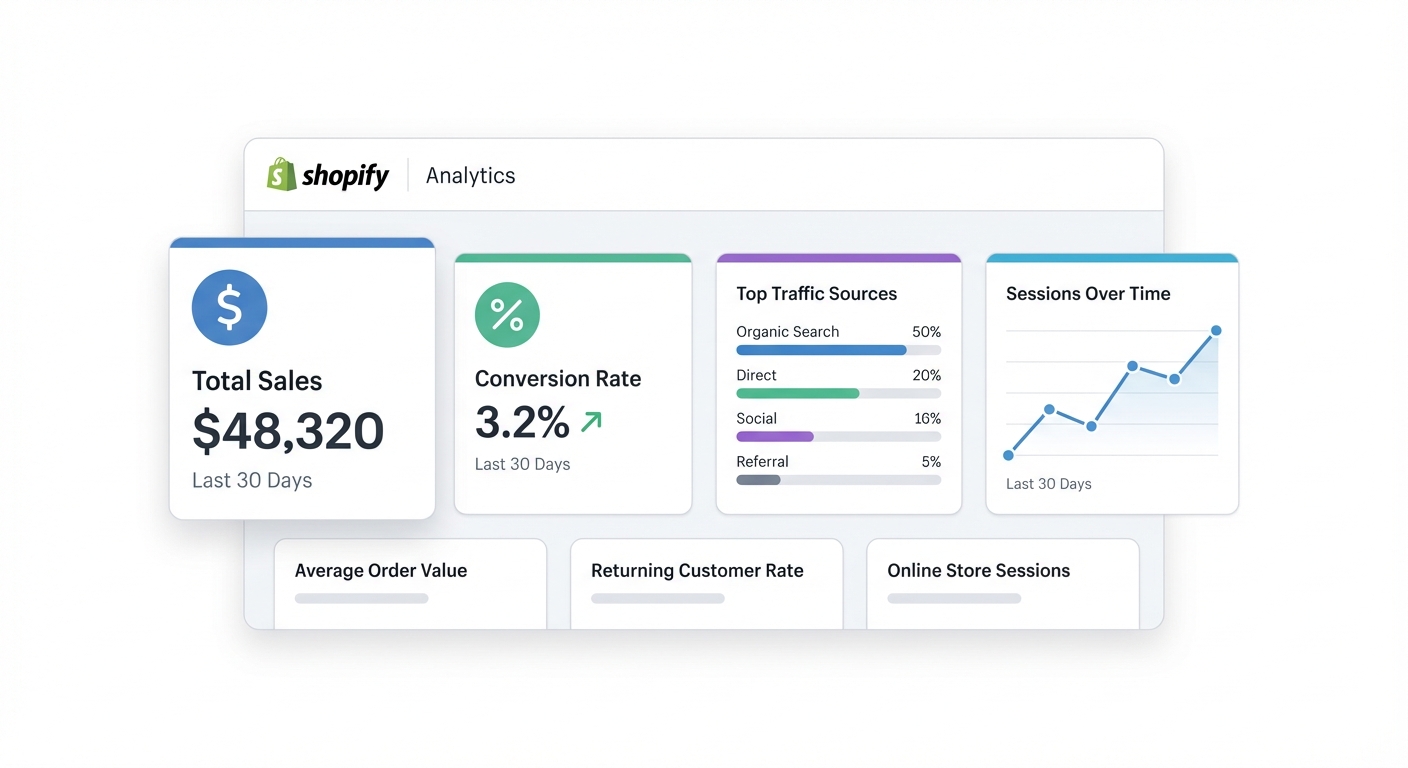
- Sales tracking: You see revenue, order count, and average order value. This is solid.
- Traffic sources: Organic, paid, direct, referral—Shopify shows where visitors came from.
- Conversion funnel: You can see browse rate, cart addition rate, and checkout completion rate. Useful.
- Product-level sales: Top products by revenue. Revenue by channel. Revenue trends over time.
- Customer insights: Return customer rate, repeat purchase behavior, customer value.
If your job is "drive more revenue and traffic," Shopify's tools are genuinely helpful. The problem is, that's not your only job. Your real job is "drive profit."
Those are not the same thing.
The 6 Critical Blind Spots in Shopify Analytics
1. No Real Profit Calculation
Here's what Shopify's "financial summary" shows you:
- Revenue
- Costs (sometimes)
- That's it.
"Costs" on Shopify usually means just what you've manually logged as COGS (cost of goods sold) in your product settings. But profit isn't revenue minus COGS. It's revenue minus everything:
- COGS (maybe you logged it, maybe you didn't)
- Payment processing fees (2.9% + $0.30, usually)
- Shipping costs
- Advertising spend
- Platform fees
- Returns and chargebacks
- Refund processing fees
Shopify subtracts payment processing fees from your payout. You never see that number in the analytics dashboard. It just vanishes from your bank transfer. Same with platform fees if you're on Shopify Plus. Returns show as a line item, but the processing fee you lose on the refund? Invisible.
What this means: A $10,000 revenue day might actually be a $6,200 profit day. You won't know which until you manually add everything up in a spreadsheet.
2. No Product-Level Profitability
Shopify will happily tell you that your limited-edition hoodie sold 412 units last quarter. Revenue winner.
Shopify won't tell you that your hoodie costs you $18 to make, takes 2.5x longer to pack than your t-shirts, and gets returned 31% of the time.
You can see products ranked by revenue. You cannot see them ranked by profit per unit. You cannot see contribution margin. You cannot see which products are actually losing you money despite selling well.
This is critical. Your top revenue generator might be your lowest-margin product. You might have a slow-moving item that's so profitable it should be featured everywhere. Shopify doesn't know. You won't know, either, unless you do the math outside Shopify.
What this means: You could be optimizing for the wrong products entirely.
3. Ad Spend Lives in a Separate Universe
You're running Facebook ads. Google Shopping ads. TikTok ads. Pinterest ads. Maybe all four at once.
In Shopify, you see the revenue those ads drove. That's genuinely useful. But the spend for those ads? It's in Facebook Ads Manager. Google Ads console. TikTok Ad Manager. Each in its own silo.
You see: "Paid social drove $34,000 in revenue last month."
You don't see: "And we spent $8,400 to get it."
So your ROAS might be 4.0x—which sounds amazing—but you're making that judgment without ever seeing ad spend and revenue on the same screen in Shopify. You have to tabulate it yourself. And if you're running multiple channels? Good luck getting a unified view of what your marketing actually cost.
What this means: You could be profitable on paid ads while Shopify analytics makes it look like you're drowning in expense.
4. Transaction Fees Are Completely Invisible in Reports
This one's almost sneaky.
When a customer pays, Shopify (or your payment processor) takes a cut. 2.9% + $0.30 on Shopify Payments, for example. This fee gets deducted from your payout. It comes out of your bank account.
But it never appears as a line item in your analytics dashboard.
You see: Revenue of $10,000.
You don't see: $290 of that is going to payment processing fees.
For a store processing $100,000/month, that's $2,900 vanishing from analytics visibility. Most stores never notice because they're focused on the revenue number, not the payout number.
What this means: Your "profit" is consistently overstated by the percentage of your revenue that's eaten by payment processing.
5. Return Costs Aren't Tracked Against Profit
A customer orders a hoodie. You pack it, ship it, she receives it, and sends it back.
In Shopify, you see: 1 return. The refund is processed.
What you don't see: The payment processing fee you lost. The shipping cost you ate (if you offered free returns). The labor to restock and inspect the item. The possibility it can't be resold as new.
Returns show as a line item, but they're listed as a count or a dollar amount. The full cost of that return—in fees, labor, and logistics—isn't deducted from your profit calculation.
Some stores have 20-30% return rates. If you're not accounting for the true cost of each return, your profit margin is fiction.
What this means: Your profit margin per product might be 2-3 percentage points worse than Shopify analytics suggests.
6. No Contribution Margin or Break-Even Metrics
Here's a concept that'll change how you think about your products:
Contribution margin = What's left after variable costs.
Break-even point = How many units you need to sell to cover fixed costs.
Shopify shows you gross profit (revenue minus COGS). That's a start. But it doesn't show contribution margin—profit per unit after all variable costs (COGS, processing fees, shipping, returns).
It also doesn't tell you how many units of a product you need to sell to break even on your fixed costs (platform fees, base advertising spend, overhead).
This matters because:
- A slow-moving, high-margin product might contribute more to covering your fixed costs than a fast-moving, low-margin one.
- Without knowing break-even, you can't confidently decide whether to kill a product or scale it.
- You can't optimize pricing without seeing the relationship between volume and contribution margin.
What this means: You're making product decisions with incomplete data.
Shopify Analytics vs. What You Actually Need
Here's a side-by-side of what Shopify shows vs. what a profit-focused tool adds:
| Metric | Shopify Shows | Profit-Focused Tool Adds |
|---|---|---|
| Revenue | ✓ Yes | ✓ Yes |
| COGS | Partial (if logged) | ✓ Full tracking + validation |
| Payment fees | ✗ No (invisible) | ✓ Yes, per transaction |
| Shipping costs | ✓ Sometimes | ✓ Always, with accuracy |
| Ad spend by channel | ✗ No (separate platforms) | ✓ Yes, unified view |
| Real profit (all costs) | ✗ No | ✓ Yes |
| Product-level profit | ✗ No | ✓ Yes, per SKU |
| Contribution margin | ✗ No | ✓ Yes |
| Break-even analysis | ✗ No | ✓ Yes |
| Return cost impact | ✗ No | ✓ Yes |
| Channel profitability | ✗ No | ✓ Yes (e.g., Amazon vs. DTC) |
| Profit per customer | ✗ No | ✓ Yes |
Shopify's job is to help you sell. A profit analytics tool's job is to help you understand what you're selling.
Track this automatically
Shopimize shows your real profit per order, per product, per channel.
Try Shopimize free →Why Shopify Can't (and Shouldn't) Do This Alone
Shopify is a commerce platform. Payment processing, inventory, order management—that's their world. Analytics features are important, but they're in service of the core product.
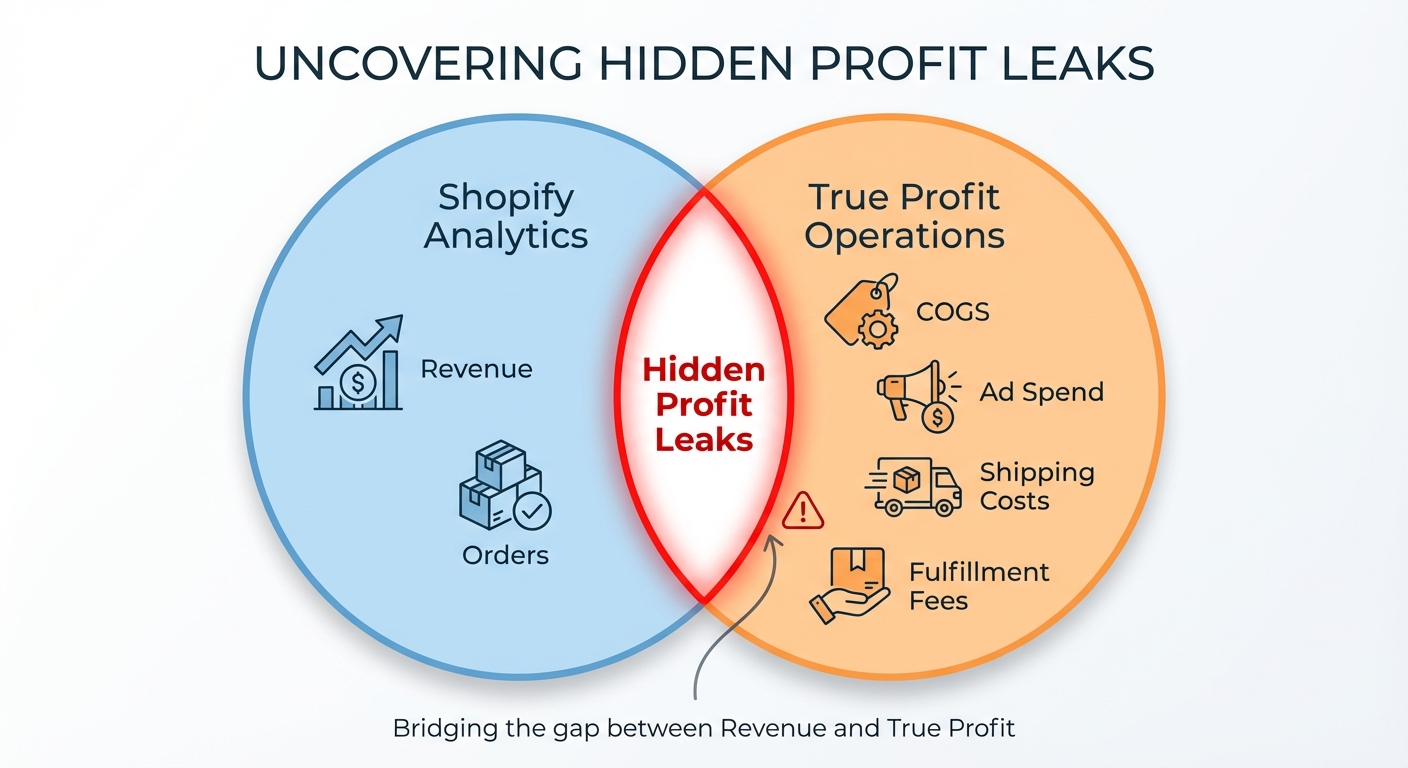
A dedicated profit analytics tool, on the other hand, exists to pull data from everywhere—your accounting system, ad platforms, email tools, marketplace feeds, shipping providers. It's a different job.
Shopify could theoretically build more of this, but it would mean:
- Building connectors to dozens of ad platforms and accounting systems.
- Becoming responsible for the accuracy of data they don't control.
- Significantly increasing product complexity for users who don't need it.
It's better that Shopify stays laser-focused on commerce, and lets specialized tools handle the analysis.
What You Should Do Right Now
If you're a Shopify store owner, you don't need to abandon Shopify or get paranoid about hidden costs. You need a three-step approach:
1. Audit your current profit assumptions.
Go through your top 10 products. For each one, manually calculate:
- Revenue (from Shopify)
- COGS (should be in your Shopify settings)
- Your share of payment processing fees
- Actual shipping cost (not what the customer paid—what you paid)
- Refund/return rate and cost per return
- Your portion of ad spend that drove that product
The real profit margin per unit might surprise you. Probably downward.
2. Set up a unified tracking system.
At minimum, create a monthly spreadsheet that pulls:
- Revenue and refunds (Shopify)
- COGS and shipping (Shopify + supplier records)
- Ad spend (Meta Ads Manager, Google Ads, TikTok, etc.)
- Payment fees (your processor or Shopify reconciliation)
This takes 30 minutes/month and gives you a real profit number.
3. Consider a profit analytics tool.
If you're scaling and this spreadsheet is starting to feel fragile, a tool like Shopimize automates the heavy lifting. You get real-time profit visibility without the manual work.
FAQ
Q: Does Shopify's "profit" metric count anything?
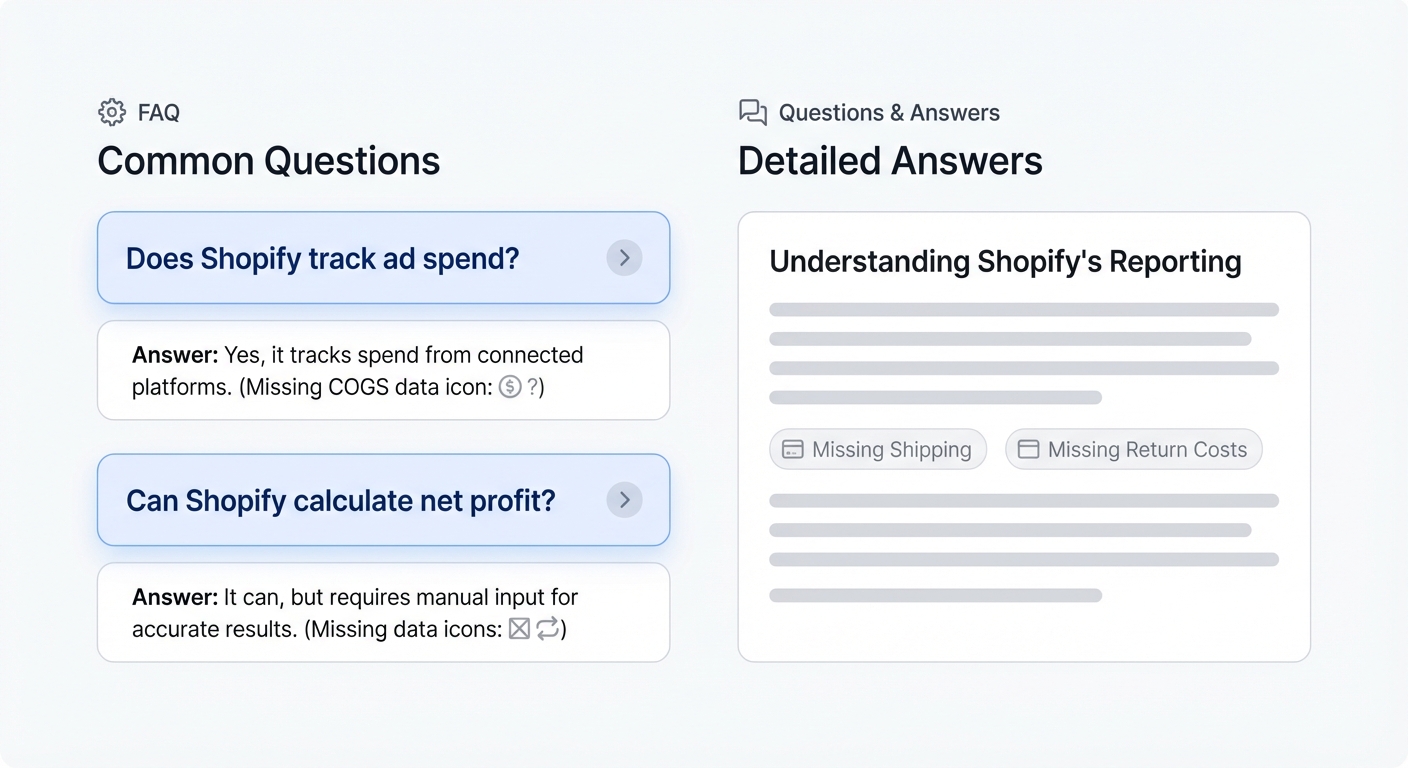
A: Shopify's financial summary can show revenue minus COGS (if you've logged it). But it doesn't include payment fees, shipping, returns, or ad spend. So it's a starting point, not a real profit number.
Q: Why don't payment fees show in my reports if they're being deducted?
A: They're deducted from your payout by the payment processor, not from a line item in Shopify. It's not hidden maliciously—it's just not part of the analytics dashboard. The information is in your transaction details and bank reconciliation, but you have to dig for it.
Q: If I log COGS in Shopify, does that give me real profit?
A: No. You'd still be missing payment fees, shipping costs, ad spend, returns, and other overhead. COGS is just one input to real profit. Most stores need at least 5-7 cost categories to get close to accurate.
Q: Can I see ad spend in Shopify if I connect my ad accounts?
A: Some integrations exist (like Facebook pixel or Google Analytics), but they're designed for attribution and conversion tracking, not unified profitability reporting. You still see ad metrics and purchase metrics separately.
Q: How much do payment fees usually impact my bottom line?
A: If you're using Shopify Payments at 2.9% + $0.30, expect to lose roughly 2.9-3.5% of revenue to processing fees (the percentage varies with average order value). On $100,000/month, that's $2,900-3,500. If you're also accounting for refund fees, it's closer to 3.5-4%.
Q: Should I manually audit all this right now?
A: If you're profitable and growing, maybe not immediately. But pick your top 5-10 products and run the numbers. You might be surprised how profit and revenue diverge.
Q: Does Shopify Plus fix any of these gaps?
A: Not significantly. Shopify Plus gives you better APIs and custom reports, but you still won't see real-time profitability with all costs included. You'd still need to build or integrate a profit analytics layer.
The Honest Truth About Shopify Analytics
Shopify's native analytics aren't broken. They're just focused. They excel at answering: "How much did we sell? Where did the traffic come from? Which products moved the most units?"
They don't answer: "How much money did we actually make?" That's a different question, and it requires different data sources.
The good news? It's solvable. Whether you build a simple spreadsheet or invest in a dedicated tool, you can get real profit visibility. It just won't come from Shopify's dashboard alone.
You deserve to know the truth about your margins. Not the revenue picture. The actual profit picture.
Want to fill the gaps Shopify analytics leaves? Try Shopimize free — real profit data where Shopify stops.