
The 15-Minute Shopify Profitability Audit Every Store Needs
You think your Shopify store is profitable. Revenue's up, orders are coming in, and it feels like you're doing well.
Then you check your bank account and something doesn't add up.
Here's what's probably happening: you're not seeing the full picture. Revenue and profit aren't the same thing—not even close. Hidden costs are eating into your margins, and you likely don't know which products are actually making money.
The good news? You can get clarity in about 15 minutes.
This audit walks you through five critical checks that'll show you the real state of your business. We'll use a real example (a home decor store doing $35K/month in revenue), so you can follow along with your own numbers.
Let's go.
[IMAGE PLACEHOLDER: An overhead shot of a coffee cup and laptop on a white desk, clock showing 15 minutes in corner. Warm, clean aesthetic. Title: "The 15-Minute Profitability Audit"]
Check 1: Your Gross Margin Reality (3 minutes)
This is where it starts. You need to know what percentage of every dollar is actually yours before you factor in any other costs.
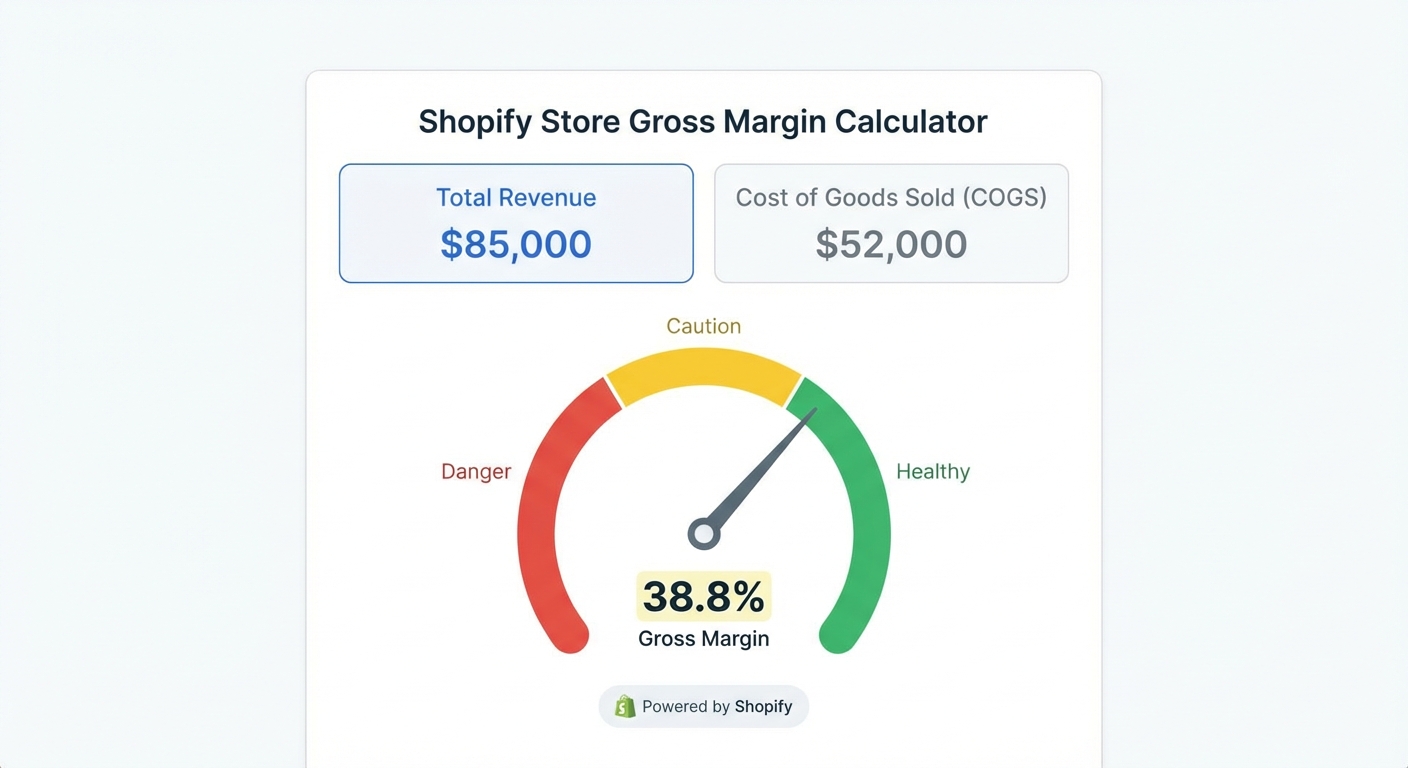
Here's what to do:
- Open your Shopify admin and go to Reports → Sales Overview (or download your last full month of data)
- Find your total revenue and total COGS (Cost of Goods Sold)
- Calculate: (Revenue − COGS) ÷ Revenue × 100 = Gross Margin %
Our example store:
- Revenue (January): $35,000
- COGS: $12,250
- Gross Margin: ($35,000 − $12,250) ÷ $35,000 × 100 = 65%
That 65% looks good at first glance. But here's the thing: COGS is just the beginning. Everything else gets paid from this 65%.
What's healthy? Most e-commerce stores should be running 50–70% gross margin. Below 50% and you're fighting an uphill battle. Above 70% and you've either got amazing sourcing or you're pricing high (or both—nice work).
Action items:
- If you're below 50%, look at your product mix. Are you selling low-margin items that don't justify the operational overhead? Consider raising prices or discontinuing SKUs that drag down your overall margin.
- If you're between 50–70%, document this number. We'll compare it to your net margin in a few minutes to see what's actually eating your profit.
[IMAGE PLACEHOLDER: Simple spreadsheet screenshot showing revenue, COGS, and gross margin calculation. Numbers highlighted in green. Modern, clean design.]
Check 2: Your Hidden Cost Stack (3 minutes)
This is where most store owners go wrong. They see that 65% gross margin and think they're golden. Then they forget about:
- Shopify subscription
- Payment processing fees
- Shipping costs (if you absorb them)
- App subscriptions
- Email marketing platform
- Paid ads
- Packaging and fulfillment labor
These add up fast.
Here's what to do:
- List every monthly or per-transaction cost
- If it's variable (like payment fees), express it as a percentage of revenue
- Add them up
Our example store's cost stack:
| Cost Category | Type | Cost |
|---|---|---|
| Shopify Plan | Fixed | $299/month |
| Payment Processing | 2.9% + $0.30 per order | ~$1,200 (at 100 orders/month) |
| Shipping Supplies | Variable | ~$1,050 (3% of revenue) |
| Apps (inventory, email, reviews) | Fixed | $180/month |
| Email Marketing Platform | Fixed | $50/month |
| Packaging & Labor | Variable | ~$1,400 (4% of revenue) |
| Total Monthly Non-Ad Costs | ~$4,179 |
$4,179 ÷ $35,000 = 11.9% of revenue
So your actual operating margin before paid ads is: 65% − 11.9% = 53.1%
That's still solid, but now we're dealing with reality.
What's healthy? Your operating costs (everything except ads and COGS) should typically be 15–25% of revenue. Below 15% and you've got an efficient machine. Above 25% and it's time to audit what's essential.
Action items:
- Go through every subscription and app. Do you actually use it? Kill anything that doesn't drive revenue or save you hours.
- If payment processing is high, shop around. Some processors offer better rates for e-commerce.
- Look at shipping—can you negotiate better rates with your fulfillment provider?
[IMAGE PLACEHOLDER: Cost breakdown pie chart or waterfall chart showing revenue flowing down through each cost category. Color-coded by category. End number highlighted prominently.]
Check 3: Your Ad Spend Efficiency (3 minutes)
Now we're at the money question: are your paid ads actually making you money, or just burning cash?
Here's what to do:
- Pull your ad spend from all channels (Google, Facebook, TikTok, etc.) for last month
- Count your total number of orders
- Calculate: Total Ad Spend ÷ Number of Orders = Cost Per Acquisition (CPA)
- Compare your CPA to your profit-per-order before ads
Our example store:
- Ad spend (all channels): $4,200
- Orders placed: 300
- CPA: $4,200 ÷ 300 = $14 per order
Now, what's the profit per order before ad spend?
- Gross profit per order: $35,000 revenue ÷ 300 orders = $116.67 average order value
- Minus COGS: $116.67 − $40.83 = $75.84 gross profit per order
- Minus operating costs: $4,179 ÷ 300 orders = $13.93 per order
- Profit per order before ads: $75.84 − $13.93 = $61.91
Your CPA is $14. Your profit per order before ads is $61.91.
That means every order from ads nets you: $61.91 − $14 = $47.91 profit per order after ads.
That's working. Your ad spend is efficient.
What's healthy? A healthy CPA should be no more than 30–40% of your profit-per-order (before ad spend). If your CPA is 50%+ of pre-ad profit, you're running on thin margins and one platform change breaks your model.
Action items:
- If your CPA-to-profit ratio is good (like this store), document it and keep doing what's working.
- If your CPA is too high, pull platform-by-platform data. Some channels might be much more efficient than others. Kill the underperformers.
- Test a 10% budget shift to your best-performing channel. Watch the results for one week before doubling down.
[IMAGE PLACEHOLDER: Funnel diagram showing ad spend entering at top, flowing down to orders, then to profit. Numbers annotated at each stage with green checkmark indicating healthy metrics.]
Track this automatically
Shopimize shows your real profit per order, per product, per channel.
Try Shopimize free →Check 4: Your Product-Level Profitability (3 minutes)
Here's the secret that changes everything: not all revenue is created equal.
You might have 10 products. 2 of them might be generating 60% of your profit. 3 of them might actually be losing money when you factor in everything.
You need to know which is which.
Here's what to do:
- Export your product data from Shopify (or a reporting tool) with: product name, units sold, revenue, and COGS
- For each product, calculate gross profit: (Revenue − COGS)
- Allocate a portion of your operating costs to each product (divide total operating costs by number of products, or weight by revenue percentage—doesn't have to be perfect)
- Subtract to get net profit per product
Our example store's top 6 products:
| Product | Units Sold | Revenue | COGS | Gross Profit | Allocated Costs | Net Profit | Margin % |
|---|---|---|---|---|---|---|---|
| Ceramic Vases (Set of 3) | 85 | $8,500 | $2,210 | $6,290 | $1,110 | $5,180 | 61% |
| Wall Mirrors | 42 | $5,460 | $2,188 | $3,272 | $710 | $2,562 | 47% |
| Plant Stands | 38 | $3,800 | $1,330 | $2,470 | $495 | $1,975 | 52% |
| Throw Pillows | 110 | $9,240 | $4,417 | $4,823 | $1,205 | $3,618 | 39% |
| Desk Lamps | 15 | $2,250 | $1,350 | $900 | $295 | $605 | 27% |
| Woven Baskets | 10 | $600 | $480 | $120 | $131 | ($11) | -2% |
What jumps out?
- Ceramic Vases are your profit engine. 61% margin, high volume.
- Throw Pillows have decent margins and move volume, but they're less profitable than vases.
- Desk Lamps are underwhelming. Low volume, low margin.
- Woven Baskets are actually unprofitable. You're losing money on every one.
What's healthy? You want your top 2–3 products to generate 50%+ of profit. You want fewer than 20% of products operating below 20% margin. Anything below breakeven? It's costing you money.
Action items:
- Double down on Ceramic Vases. Increase ad spend to this product, feature it prominently, create bundles with it.
- Run a test: raise Desk Lamp prices by 15%. If volume doesn't drop significantly, you've found hidden profit.
- Kill Woven Baskets, or redesign the cost structure. Negotiate better COGS, or raise the price to $15.
[IMAGE PLACEHOLDER: Product comparison bar chart showing profit by product. Top performers highlighted in green, underperformers in orange/red. Each product has a simple icon (vase, mirror, lamp, etc.) for visual clarity.]
Check 5: Your Trend Direction (3 minutes)
The last check is simple but reveals whether you're moving in the right direction.
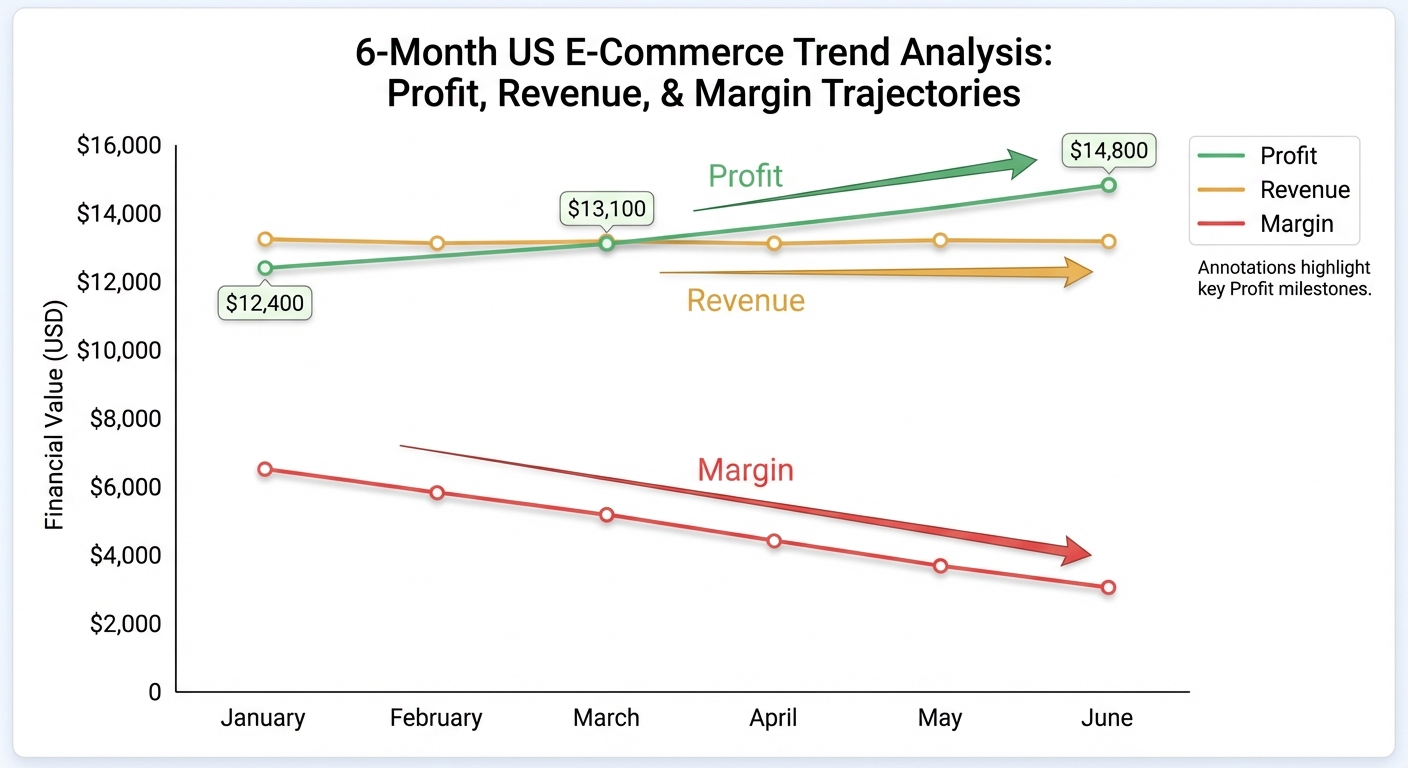
Pull the last three months of data and see: are your margins improving or sliding?
Here's what to do:
- For each of the last three months, calculate:
- Total Revenue
- Gross Margin %
- Operating Costs as % of Revenue
- Net Profit Margin: (Revenue − COGS − Operating Costs) ÷ Revenue × 100
Our example store (three months):
| Month | Revenue | COGS | Gross Margin % | Operating Costs | Net Profit | Net Margin % |
|---|---|---|---|---|---|---|
| November | $31,000 | $11,160 | 64% | $4,250 | $15,590 | 50% |
| December | $38,500 | $13,475 | 65% | $4,450 | $20,575 | 53% |
| January | $35,000 | $12,250 | 65% | $4,179 | $18,571 | 53% |
What we see:
- Gross margin is stable (64–65%), which is good—you're not letting COGS creep up.
- Operating costs are stable as a percentage of revenue, which is also good.
- Net margin is trending up slightly and holding at 53%.
The verdict: This store is stable. Not growing explosively, but margins aren't eroding. That's healthy.
What's healthy? You want to see margins either stable or improving month-to-month. A 2–3% improvement in net margin over three months is solid. If margins are declining, it usually means one of three things: COGS is rising (supplier prices going up), ad spend is getting less efficient, or operating costs are growing. Find the culprit.
Action items:
- If margins are improving, identify what changed. Double down on it.
- If margins are declining, dig into the trend. Is it one product dragging things down? Is ad spend less efficient? Did a platform raise fees?
- Set a target. "We want 55% net margin by Q3." Now you have something to work toward.
[IMAGE PLACEHOLDER: Line graph with three lines: gross margin %, operating costs %, and net margin %. Lines are relatively flat but slightly trending upward. Dates on x-axis, percentages on y-axis. Clean, professional.]
Your Profitability Scorecard
Here's a quick reference. For each check, where does your store stand?
| Check | Green (You're Good) | Yellow (Needs Attention) | Red (Action Required) |
|---|---|---|---|
| Gross Margin | 55–70% | 45–55% | Below 45% |
| Operating Costs | 12–18% of revenue | 18–25% of revenue | Above 25% of revenue |
| Ad CPA | CPA ≤ 30% of pre-ad profit | CPA = 30–45% of pre-ad profit | CPA ≥ 45% of pre-ad profit |
| Product Mix | Top 3 products = 50%+ profit | Top 3 products = 40–50% profit | Top 3 products = Less than 40% |
| Margin Trend | Stable or improving | Flat with slight decline | Declining month-to-month |
Count how many greens you have. If you've got 4–5 greens, you're doing better than 80% of e-commerce stores. If you've got 2–3 greens, you've found the work that matters most. If you're all yellow/red, don't panic—now you know what to fix, and you can tackle it systematically.
Why This Matters (And Why Most Stores Get It Wrong)
Most Shopify store owners optimize for revenue. They chase top-line growth because it's visible and it feels like progress.
What they miss is that revenue is a vanity metric if it's not profitable revenue.
You can have a $100K/month store that's actually losing money. You can have a $30K/month store that's generating $15K/month in profit. The difference isn't luck or talent—it's visibility.
The stores that win are the ones that know their numbers. They know which products make money. They know which ads work. They know where costs are eating profit. And they make decisions based on that, not on hunches.
This 15-minute audit gives you that visibility.
FAQ
How often should I run this audit?
Monthly. It only takes 15 minutes. Do it on the same day each month (first Monday, maybe?) so you build the habit. Over time, you'll start to notice patterns and spot problems early.
What if my numbers don't look like the example?
That's fine. Every store is different. What matters is that you know your numbers. Use this as a template, plug in your data, and see where you stand. The benchmarks (gross margin 55–70%, operating costs 12–18%, etc.) are guidelines, not rules.
Should I include ad spend in operating costs or calculate it separately?
Calculate it separately, like we did. Ad spend is variable and directly tied to revenue generation. Operating costs (Shopify, apps, etc.) are overhead. They behave differently, so treat them differently.
What if I don't have detailed COGS data?
Start now. COGS is the most important number you're tracking. If you're not sure what it is, estimate conservatively (guess high). Then commit to getting exact data going forward. You can't optimize what you don't measure.
My CPA is really high. Does that mean ads don't work?
Not necessarily. A high CPA might mean you need better targeting, better creative, or a different platform. It could also mean your product margins are just too thin for paid ads to work at scale. Test small adjustments first (new audience, new ad angle) before cutting ad spend entirely.
What's the fastest way to improve my margins?
Product-level profitability work usually pays off fastest. Kill or fix your unprofitable products. Raise prices on products with low margins (test 10–15% increases). The vases and mirrors in our example generate way more profit than the baskets, so shifting focus there is high-leverage.
Should I be worried if my margins don't match industry benchmarks?
Not necessarily. Some industries naturally run thinner. Clothing and home goods often do. Niche, high-ASP products can support higher margins. What matters is that your margins are healthy for your category, and that you're improving or stable month-to-month.
Next Steps
You've now got a clear picture of your profitability. Here's what to do:
- Document your five numbers. (Gross margin %, operating cost %, CPA, top product profit, trend)
- Pick one thing to improve. Usually it's product mix, cost-cutting, or ad efficiency. Start there.
- Set a 30-day target. "Improve net margin from 50% to 52%." Something measurable.
- Run the audit again in one month. See if you moved the needle.
That's it. This isn't about being perfect. It's about knowing your business well enough to make smart decisions.
And if you want to skip the manual work and get these insights every day, automatically calculated for every product across every channel? That's what Shopimize does.
Want this audit done automatically — every day, for every product? Try Shopimize free and see your real profitability in under two minutes.