
The Break-Even ROAS Calculator Every Shopify Store Needs
Most Shopify store owners know what ROAS stands for. Fewer know what it actually means for their profit. And almost none know the specific number — their break-even ROAS — below which every sale from an ad is quietly draining their bank account.
That number is different for every store. It depends on your margins, your fees, your shipping costs. And yet most merchants are running ads without knowing it.
This article will show you how to calculate your break-even ROAS, what to do once you have that number, and why a break-even ROAS calculator changes the way you think about every campaign you run.
What is break-even ROAS?
Break-even ROAS is the minimum return on ad spend required for a sale to neither make nor lose money. Below that number, your ads are unprofitable. Above it, you're in the green. It's not about revenue — it's about whether the margin on a sale is high enough to cover what you spent to get it.
The formula is straightforward:
Break-Even ROAS = 1 ÷ Net Margin (as a decimal)
If your net margin is 25%, your break-even ROAS is 4.0. That means for every $1 you spend on ads, you need $4 back in revenue just to break even.
Why Your Target ROAS Is Probably Wrong
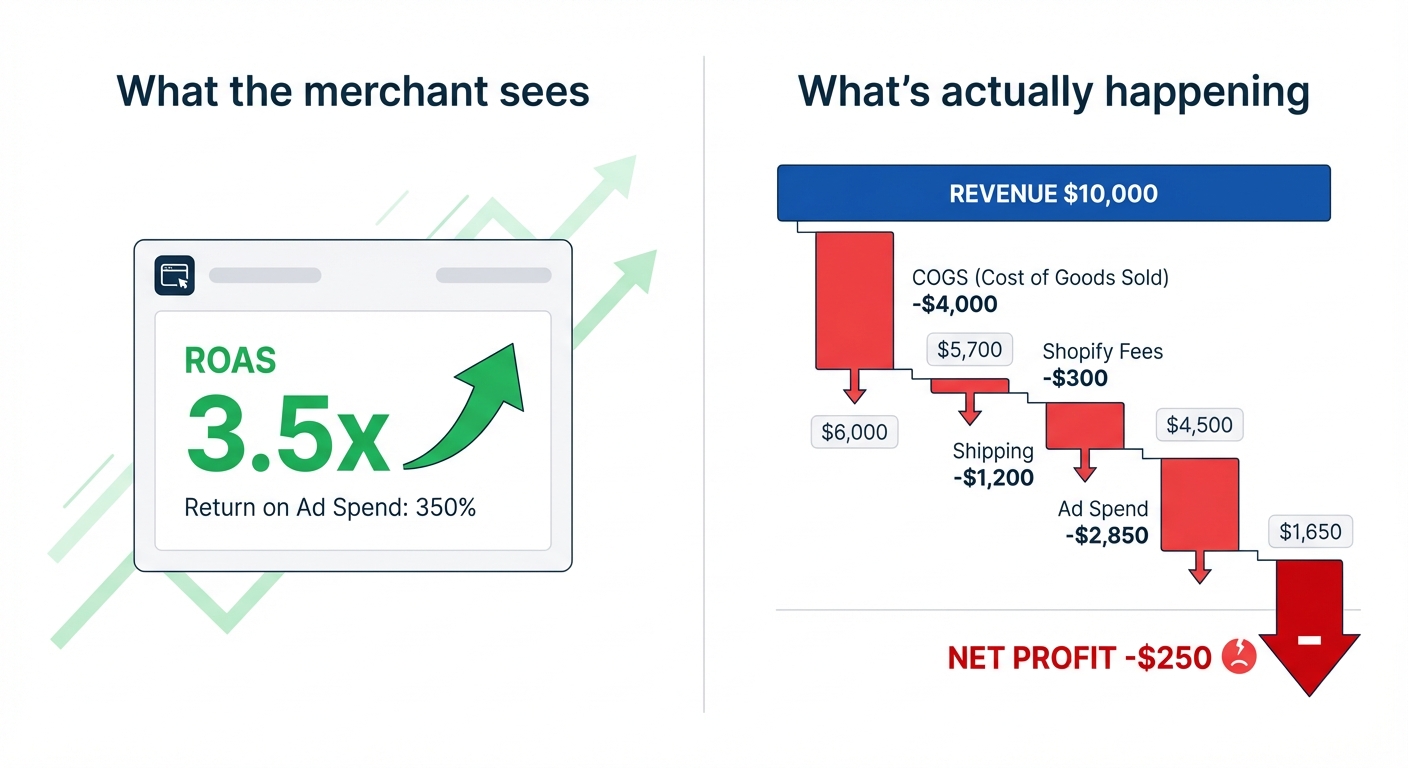
Here's a scenario that plays out constantly: a store is hitting a 3.5x ROAS on Facebook and the owner is happy. Revenue is up, the algorithm is working, life is good.
But their product costs $18 to source. It sells for $55. Shopify Payments takes 2.9% + $0.30 per transaction. Shipping runs $7 per order. They spend about $3 per order on packaging. And their actual net margin — after everything — is around 22%.
Their break-even ROAS? 4.55.
They've been losing money on every single ad-driven sale for three months.
This is not a rare story. It's the default story for merchants who set a ROAS target based on gut feel, industry benchmarks, or whatever their agency told them sounded good. The only ROAS target that matters is the one derived from your actual numbers.
How to Calculate Your Break-Even ROAS
You need two things: your revenue per order and your total costs per order (excluding ad spend). From those, you get your net margin before ads, which becomes the input for your break-even ROAS calculation.
Step 1: Start with your average order value (AOV)
Pull your AOV from Shopify Analytics for the last 30 days. Let's say it's $65.
Step 2: Subtract your cost of goods sold (COGS)
Your cost of goods sold (COGS) is what you actually paid for the product — manufacturing, sourcing, or wholesale cost. Don't average this loosely; use real numbers per unit. For our example: $20.
Step 3: Subtract transaction and platform fees
Shopify Payments charges 2.9% + $0.30 for online transactions on the Basic plan. On a $65 order, that's $2.19. If you're on Shopify Plus or a higher plan, the rates drop — but always use your actual rate. (See current Shopify Payments fees here.)
Step 4: Subtract shipping costs
What does it actually cost you to ship an order? Not what you charge the customer — what you pay. If you offer free shipping, the full cost hits your margin. If you charge for shipping, subtract the net difference. In our example, shipping costs $6.50 and the customer pays $5.99, so the net shipping cost to the store is $0.51.
Step 5: Subtract all other variable costs
Packaging, inserts, returns allowance, any per-order costs. Estimate $2.50 for packaging and a 5% return rate on a $65 order (that's about $3.25 amortized per order). Call it $5.75 total.
Step 6: Calculate your net margin before ad spend
- AOV: $65.00
- COGS: −$20.00
- Fees: −$2.19
- Net shipping cost: −$0.51
- Other variable costs: −$5.75
- Profit before ad spend: $36.55
- Net margin before ad spend: 56.2%
Step 7: Calculate your break-even ROAS
Break-Even ROAS = 1 ÷ 0.562 = 1.78
For every $1 you spend on ads, you need $1.78 in revenue. That's a much lower bar than most store owners expect — and also lower than most agencies set as targets. Which means either you have more room to scale, or you haven't been accounting for a profit target above zero.
The real insight here is that break-even ROAS on its own isn't the goal — it's the floor. You want to operate above it, ideally with a target ROAS that leaves enough margin to actually grow the business.
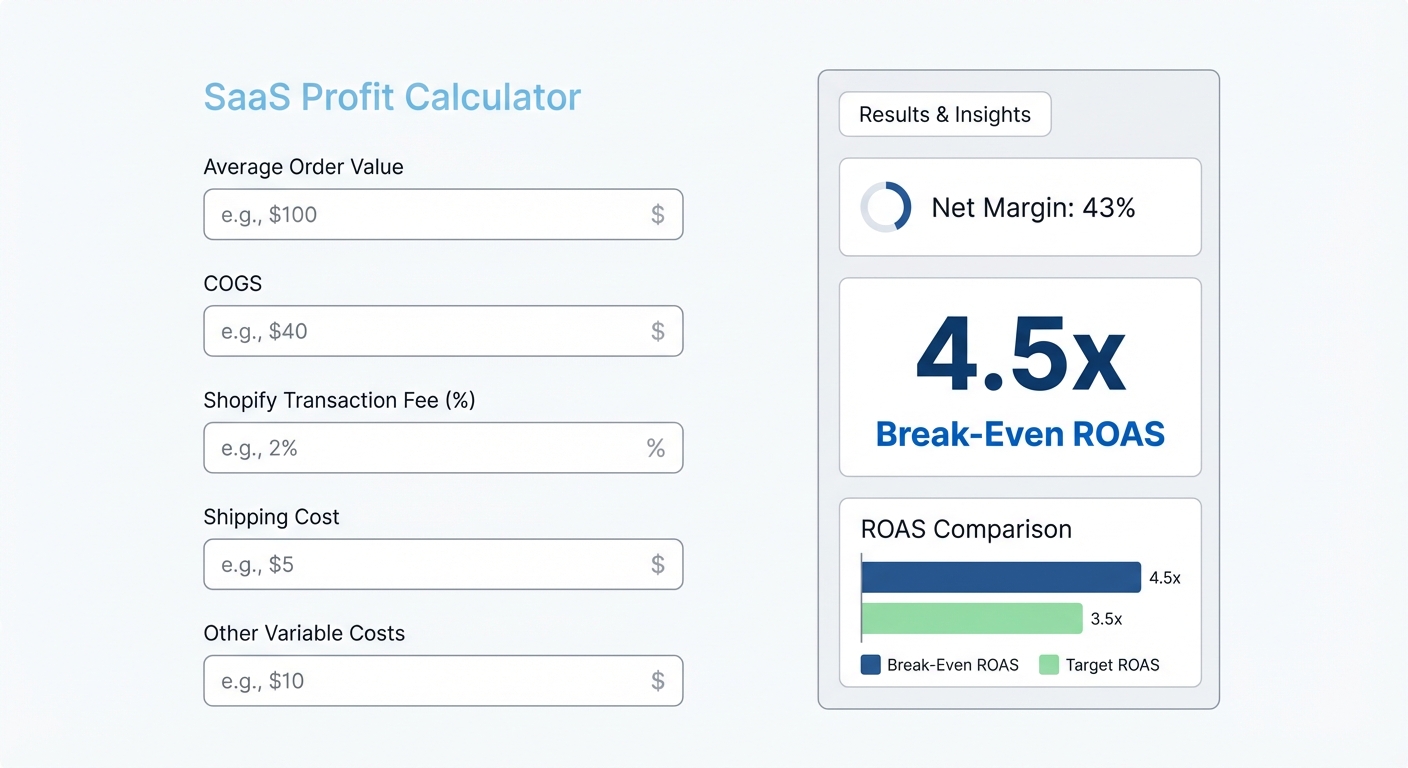
You can run these exact numbers using our free profit calculator — plug in your own COGS, fees, and shipping to get your actual margin in seconds.
Track this automatically
Shopimize shows your real profit per order, per product, per channel.
Try Shopimize free →The Hidden Costs That Blow Up Your Calculation
Most merchants undercount their costs when doing this calculation — not because they're careless, but because some costs are easy to forget.
Shopify subscription fees
Your monthly Shopify plan — Basic ($39/month), Shopify ($105/month), Advanced ($399/month) — is a real cost of doing business. If you do 200 orders a month on the Basic plan, that's $0.20 per order added to your cost base. Not huge, but it shifts the number.
Apps and tools
If you're paying for a review app, a loyalty app, a subscription billing tool, and a live chat tool, those fees add up. A store paying $150/month across apps at 200 orders is adding $0.75 per order to costs.
Payment processing outside Shopify Payments
Using a third-party payment processor? Shopify adds a transaction fee on top of your processor's fee — 2% on Basic, 1% on Shopify, 0.5% on Advanced. That compounds quickly.
Ad platform fees you're not attributing
Some stores run ads across Facebook, Google, and TikTok simultaneously. If you're not attributing ad spend per channel accurately, your ROAS calculations are blended averages that hide what's working and what's bleeding.
None of these costs are mysterious — but they all need to be in the calculation for your break-even ROAS to be accurate.
What to Do With Your Break-Even ROAS Number
Once you have it, here's how to use it.
Set it as your hard floor, not your target. If your break-even ROAS is 2.1, any campaign consistently below 2.1 is losing money. Kill it or restructure it. No exceptions for "brand building" unless you've explicitly budgeted for that separately.
Build in a profit target above it. Break-even is zero profit. If you want a 10% net profit margin from advertising, factor that into your target ROAS. Using the example above (56.2% margin before ads), to net a 10% profit margin after ads, you need your ad cost to be no more than 46.2% of the margin — which translates to a target ROAS of around 2.17. Use the formula: Target ROAS = 1 ÷ (Margin% − Desired Net%).
Use it at the campaign level, not the account level. A blended ROAS of 3.5x looks fine until you realize one campaign is at 5.2x and another is at 1.8x. You're cross-subsidizing a loser with a winner. Your break-even ROAS should be applied at the ad set or campaign level where possible.
Recalculate when your costs change. Supplier raises prices? Shipping carrier increases rates? Shopify changes its fee structure? Your break-even ROAS changes too. This isn't a one-time calculation — it's a living number.
Why Most ROAS Tracking Tools Miss the Point
The standard ROAS metric that Facebook, Google, and TikTok report back to you is based on revenue attributed to their platform. It doesn't know what your product cost. It doesn't know what Shopify charged you in transaction fees. It doesn't know your shipping costs or your return rate.
So when your Facebook Ads dashboard says you're hitting 4x ROAS, that's a revenue ratio. It's not a profit ratio. And the gap between those two things is your entire business model.
This is why many merchants are genuinely surprised when they do a proper profitability breakdown for the first time. The ad platform shows green. The Shopify dashboard shows revenue. But when you subtract every real cost from every ad-attributed order, the actual profit is a fraction of what they expected — sometimes negative.
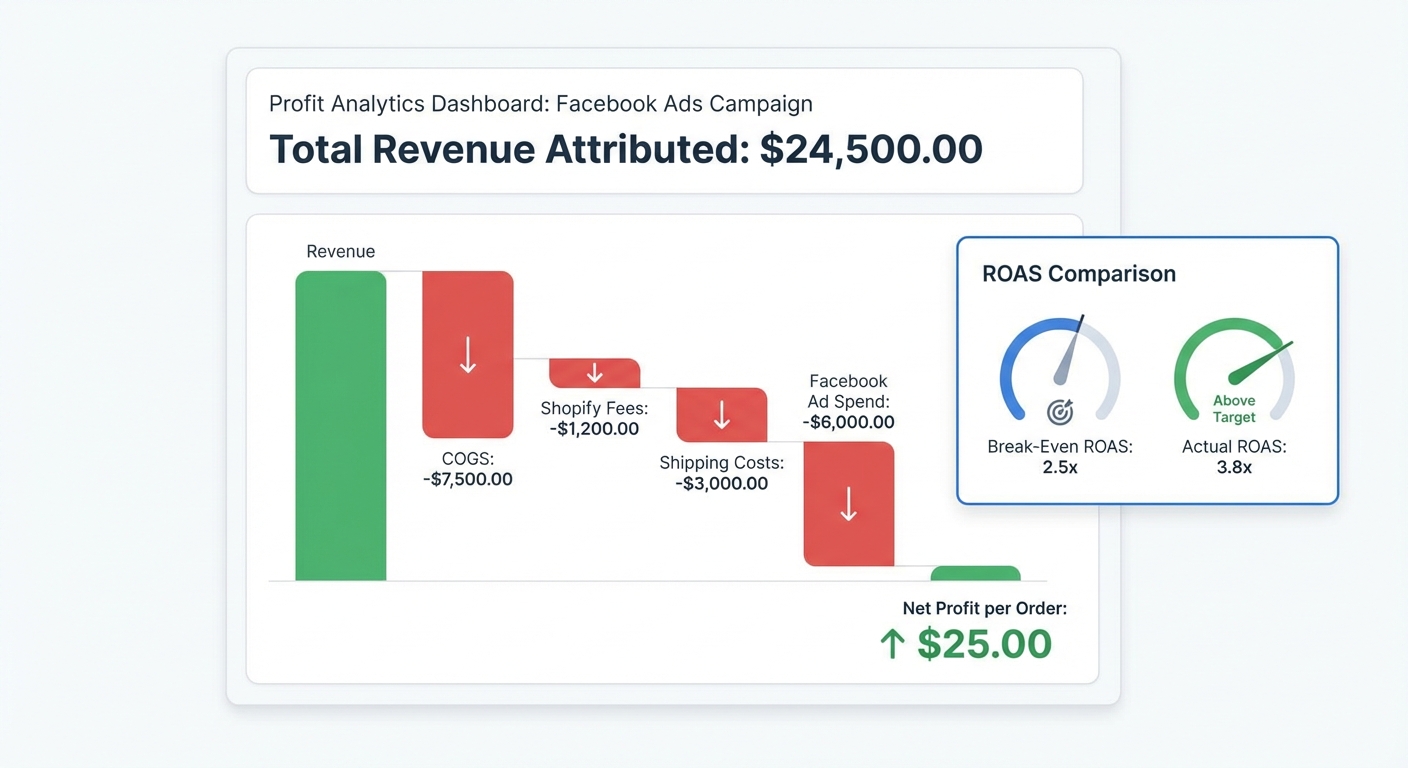
What you actually need is a view that starts with revenue, subtracts COGS, subtracts platform fees, subtracts shipping, subtracts ad spend by channel, and surfaces a real profit number per order, per channel, and per campaign.
Building a Habit Around Break-Even Thinking
The merchants who actually improve their profitability aren't the ones who check their ROAS dashboard every morning. They're the ones who build a mental model of their unit economics — and make decisions through that lens.
That means knowing, roughly, what it costs to fulfill an order before ads touch it. It means treating ROAS as a margin proxy rather than a performance score. And it means being willing to pause a campaign that looks good on paper because the underlying math doesn't work.
It also means updating your numbers. If your supplier raises prices by 15%, your break-even ROAS increases immediately — even if nothing else about your ad strategy changes. Most merchants don't update their targets when input costs shift. That's where the slow, invisible margin erosion happens.
The discipline here isn't complicated. It's just not automatic unless you have a tool that keeps the real numbers visible.
That's exactly what Shopimize is built for. Instead of patching together Shopify reports, ad platform dashboards, and a spreadsheet, Shopimize pulls your real costs — COGS, fees, shipping, ad spend — into a single profit view, so your break-even ROAS calculation is always based on current, accurate data rather than last month's guesswork.
Your Break-Even ROAS Is the Most Honest Metric You Have
Every other ROAS number you see — from your ad platforms, from your agency reports, from industry benchmarks — is built on someone else's assumptions. Your break-even ROAS is built on your numbers: your costs, your margins, your business model.
Get that number right, and every ad decision you make becomes sharper. You'll know exactly which campaigns are growing your profit and which ones are subsidizing ad platform revenue at your expense. That's what a break-even ROAS calculator actually gives you — not just a formula, but a clear line between profitable and unprofitable advertising.
Shopimize keeps that line visible at all times, so you're never guessing whether your ads are working.
FAQ
What is a good break-even ROAS for a Shopify store?
There's no universal answer — break-even ROAS depends entirely on your net margin before ad spend. A store with a 40% margin needs a 2.5x ROAS to break even. A store with a 20% margin needs 5.0x. Calculate yours using your actual cost structure, not an industry benchmark.
How is break-even ROAS different from target ROAS?
Break-even ROAS is the minimum ROAS required to avoid losing money on ad-driven sales. Target ROAS is the ROAS you need to hit a specific profit goal above zero. Your target ROAS should always be higher than your break-even ROAS — the difference represents your intended profit margin from advertising.
Does my break-even ROAS change over time?
Yes, and more often than most merchants realize. Any change to your input costs — COGS, shipping rates, Shopify fees, packaging — shifts your margin and therefore changes your break-even ROAS. Recalculate any time your cost structure changes, and review it at least quarterly even if nothing obvious has shifted.
Can I use the same break-even ROAS for Facebook, Google, and TikTok?
The break-even ROAS formula is the same across channels, but your costs might differ slightly by channel — for example, if average order values differ by traffic source or if return rates vary. For the most accurate view, calculate break-even ROAS using the average order metrics specific to each channel's customer behavior where you have enough data to do so.