
ROAS vs profit: Why a high ROAS can still lose you money
You're running Facebook ads with a 4x return on ad spend. Your ad account looks great. Revenue is climbing. And somehow, at the end of the month, there's less money in your bank account than you expected.
This is one of the most common — and most frustrating — situations Shopify merchants face. The ROAS vs profit disconnect is real, and it catches a lot of store owners off guard. This article explains exactly why a high ROAS can be misleading, what you should be tracking instead, and how to know if your ads are actually making you money.
What is ROAS, and why does it feel so good?
Return on ad spend (ROAS) is a metric that measures how much revenue you generate for every dollar you spend on advertising. A 4x ROAS means that for every $1 you spent on ads, you brought in $4 in revenue.
The formula is straightforward:
ROAS = Revenue from ads ÷ Ad spend
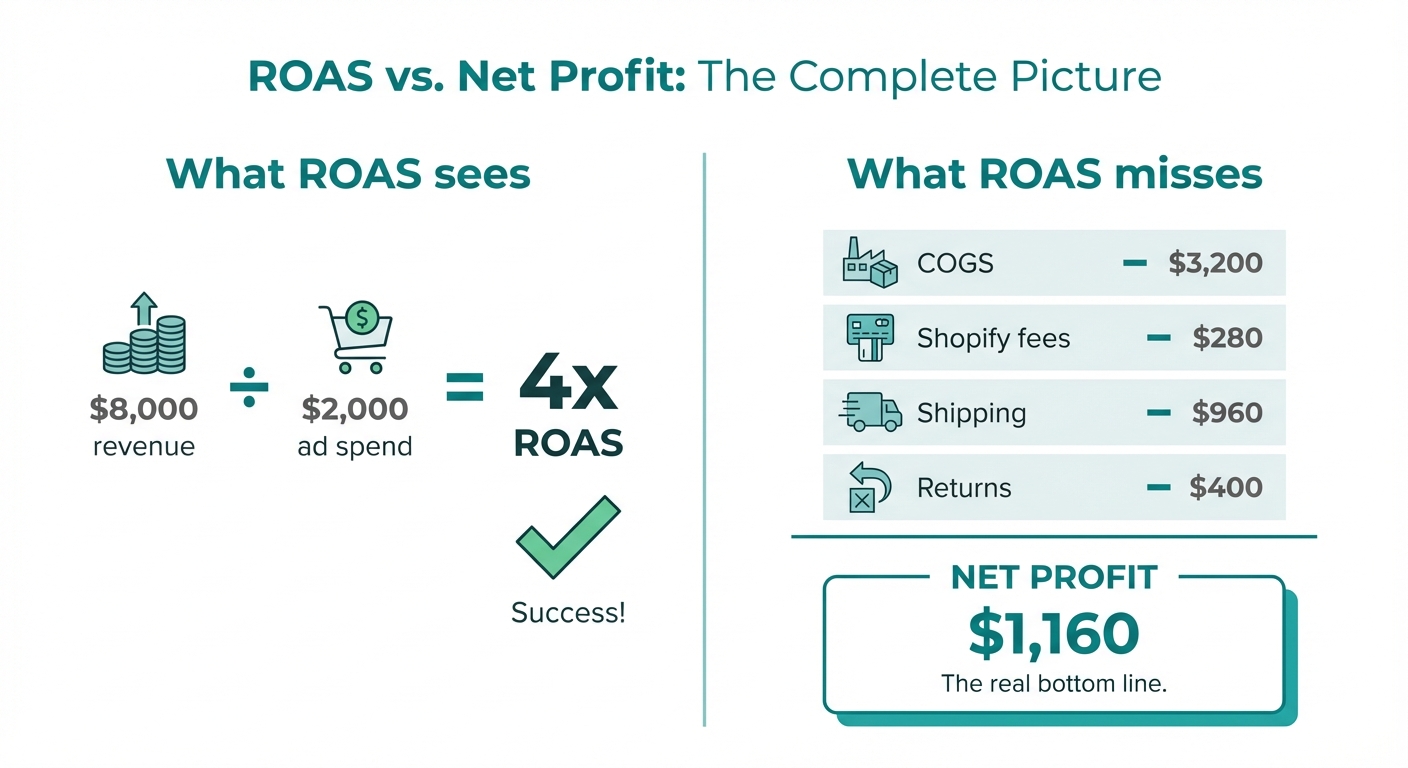
So if you spent $2,000 on Facebook ads last month and those ads drove $8,000 in revenue, your ROAS is 4x.
That sounds like a win. And ad platforms love showing you this number prominently, because it looks impressive. But ROAS is a revenue metric, not a profit metric. It has no idea what it cost you to fulfill those orders.
Why ROAS doesn't tell you if you're profitable
Here's the core problem: ROAS only compares revenue to ad spend. It ignores everything else.
Let's run through a real example.
Say you're selling a skincare product for $50. You spent $2,000 on ads last month, which drove 160 orders — $8,000 in revenue. Your ROAS is 4x. Looks solid.
Now let's look at what it actually cost to generate that $8,000:
| Cost | Amount |
|---|---|
| Cost of goods sold (COGS) | $3,200 ($20/unit) |
| Ad spend | $2,000 |
| Shopify Payments fees (2.9% + 30¢/order) | $280 |
| Shipping | $960 ($6/order) |
| Returns (5% return rate) | $400 |
| Total costs | $6,840 |
| Net profit | $1,160 |
So on $8,000 in revenue, you made $1,160. That's a net margin of about 14.5%. Not bad — but not what a 4x ROAS implies. And if your COGS were slightly higher, or your return rate crept up, or you had a Shopify plan fee to account for, that margin compresses fast.
Now imagine your ROAS drops to 3x. You'd probably panic and adjust your campaigns. But if your product costs change or you renegotiate shipping, a 3x ROAS might actually be more profitable than your current 4x.
That's the trap. Optimizing for ROAS can actively work against your profits.
The real number you should track: net profit per order
Forget ROAS for a moment. The number that actually tells you whether your advertising is working is net profit per order.
Here's how to calculate it:
- Start with your selling price — e.g., $50
- Subtract your COGS — e.g., $20, leaving $30 gross profit
- Subtract Shopify Payments fees — 2.9% + $0.30 per transaction = ~$1.75, leaving $28.25
- Subtract shipping cost — e.g., $6, leaving $22.25
- Subtract your ad spend per order (cost per acquisition) — $2,000 ÷ 160 orders = $12.50 CPA, leaving $9.75
- Account for returns — at a 5% return rate, adjust by roughly $0.50–$1.00 per order
Net profit per order: approximately $8.75–$9.25
That's your real number. That's what you're actually making every time a customer buys from you through your ads.
Now you can ask the real question: is that acceptable? Can you scale it? What happens to this number if you increase ad spend and CPA rises from $12.50 to $18?
When CPA climbs to $18, your net profit per order drops to around $4. You're still running a 4x ROAS on paper, but you've just cut your profit in half.
Track this automatically
Shopimize shows your real profit per order, per product, per channel.
Try Shopimize free →What a profitable ROAS actually looks like (it depends on your margins)
There's no universal "good ROAS." This is worth repeating because a lot of merchants benchmark against numbers they've read online.
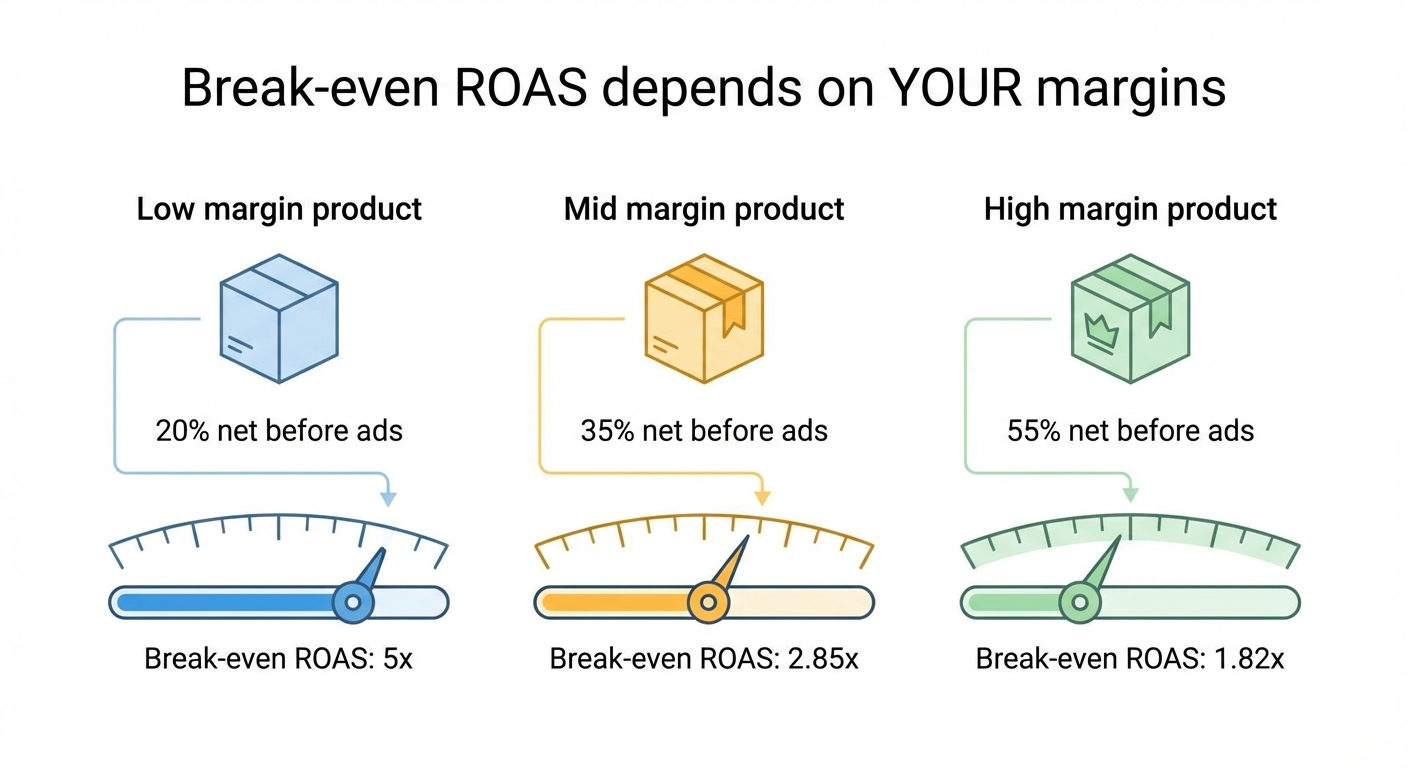
Your break-even ROAS is the ROAS at which you're covering all your costs but making zero profit. The formula:
Break-even ROAS = 1 ÷ Net margin (before ad spend)
Let's say your product has the following profile:
- Selling price: $50
- COGS: $20 (40% of revenue)
- Shipping: $6 (12%)
- Transaction fees: ~$1.75 (3.5%)
- Total non-ad costs: $27.75, which is 55.5% of revenue
- Gross margin before ads: 44.5%
Break-even ROAS = 1 ÷ 0.445 = 2.25x
So anything above 2.25x ROAS is technically profitable for this product. A 4x ROAS looks great here. But if you sell higher-ticket items with thinner margins — say 20% net before ads — your break-even ROAS is 5x. That changes everything.
You can work through your own numbers with our free profit calculator — it walks through exactly this kind of margin analysis.
How ad platforms make this worse
Facebook, Google, and TikTok all have strong incentives to show you high ROAS numbers. They report revenue attributed to their platform, but attribution is messy in practice.
A customer might click your Facebook ad, leave without buying, search for your brand on Google three days later, and convert through a Google search. Facebook often claims that sale anyway (depending on your attribution window). You could be counting that same sale in two places.
On top of that, platforms typically report on gross revenue — before returns, chargebacks, and refunds. A customer who returns your product three weeks later is still counted in last month's ROAS.
Shopify's own documentation acknowledges the complexity of multi-channel attribution, and it's something every merchant running paid traffic across multiple channels should understand.
The result: your ad dashboard often shows revenue that never actually landed in your pocket.
The metrics that actually matter alongside ROAS
ROAS isn't useless — it's just incomplete. Here's a better framework for evaluating your paid advertising:
Net profit per order
Covered above. This is your north star. Know it for every product you're advertising.
Cost per acquisition (CPA)
How much you're actually paying to acquire each customer. CPA can rise as you scale — your best audiences get saturated and you move into colder ones. Watch this number weekly.
Customer lifetime value (LTV)
If your customers buy again, a first-order ROAS that looks thin might still be a great acquisition. A $10 net profit on first purchase is fine if 30% of those customers make two more purchases at the same margin over the next six months.
Contribution margin
Revenue minus all variable costs — COGS, transaction fees, shipping, ad spend. This is the number that funds your fixed costs (team, software, rent). If your contribution margin is negative, you're losing money with every sale. No amount of volume fixes that.
Blended ROAS vs channel ROAS
Blended ROAS is your total revenue divided by your total ad spend across all channels. It's a sanity check that cuts through attribution noise. If your blended ROAS is 2.2x and your break-even is 2.25x, you're barely breaking even — even if individual channels look healthy.
A scenario where 2x ROAS beats 4x ROAS
Let's make this concrete.
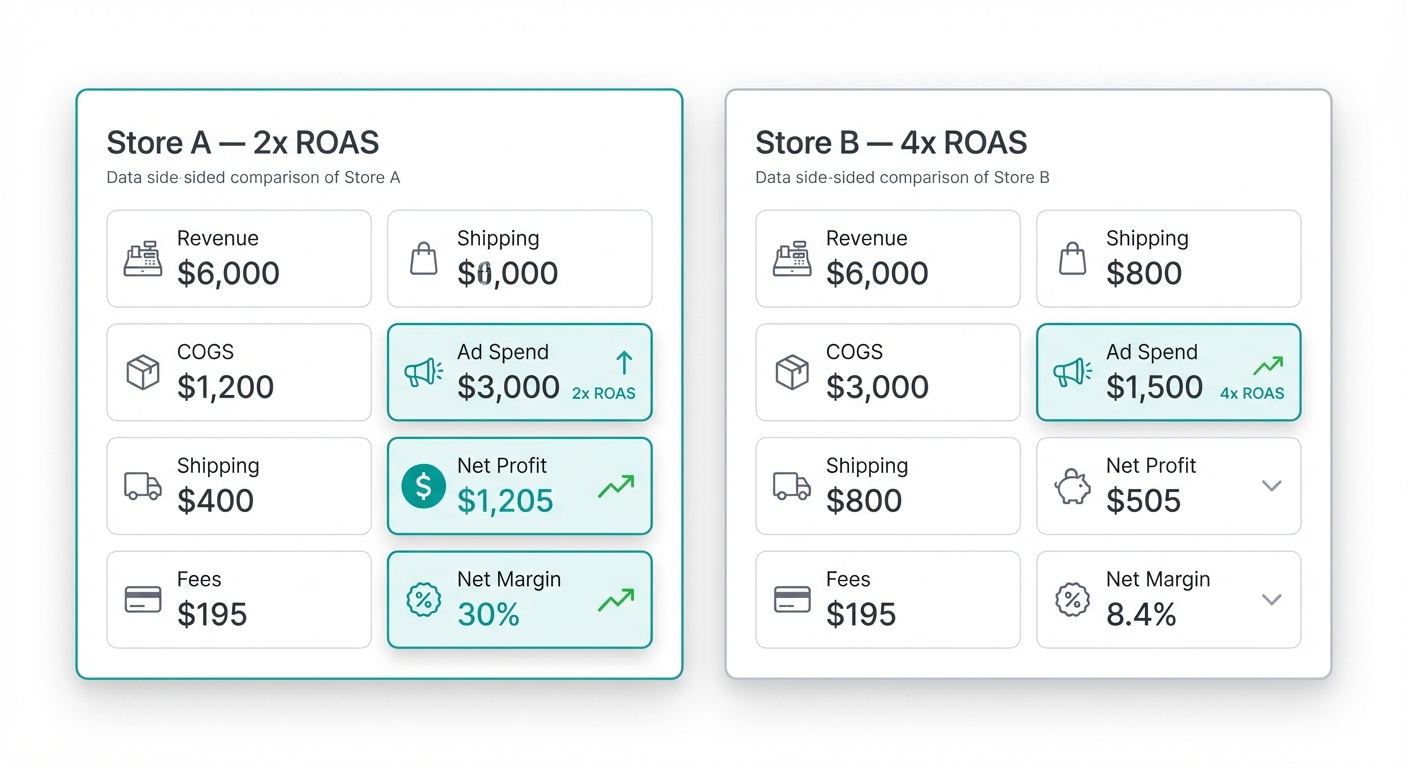
Store A sells a supplement at $60. COGS is $12. They've built efficient fulfillment ($4 shipping) and have a 2% return rate. Their non-ad cost structure is tight.
- Gross margin before ads: ($60 - $12 - $4 - $1.95 fees) / $60 = 70%
- Break-even ROAS: 1 ÷ 0.70 = 1.43x
- Actual ROAS: 2x → net margin after ads: ~30%
Store B sells the same priced item ($60) but it's a dropshipped product. COGS is $30, shipping is $8, return rate is 8%.
- Gross margin before ads: ($60 - $30 - $8 - $1.95) / $60 = 33.4%
- Break-even ROAS: 1 ÷ 0.334 = 2.99x
- Actual ROAS: 4x → net margin after ads: ~8.3%
Store A's 2x ROAS makes 30 cents on every dollar of ad-driven revenue. Store B's 4x ROAS makes 8.3 cents.
Store A is 3.6x more profitable per revenue dollar — with half the ROAS.
This isn't a theoretical edge case. It's what happens when you optimize for the wrong number.
How to track real profit from your ad campaigns
Here's a practical process for connecting your ad performance to actual profit:
- Know your unit economics — Calculate COGS, shipping, and fees per product before you run a single ad. This is non-negotiable.
- Set a target CPA, not a target ROAS — Work backwards from your desired net profit per order to figure out the maximum you can spend to acquire a customer.
- Track returns separately — Returns kill margins quietly. Build a return-adjusted revenue number into your monthly review.
- Use blended ROAS as a cross-check — Pull your total revenue and total ad spend each week. If blended ROAS is creeping down toward your break-even, something changed.
- Review profit by product, not just by campaign — An ad campaign might look profitable overall while one underperforming product is dragging down your real numbers. You need margin data at the SKU level.
- Reconcile monthly — At the end of each month, compare what your ad dashboards reported versus what actually hit your bank account after refunds, fees, and fulfillment costs.
The goal is to replace "my ROAS is 4x" with "I made $9.25 per order after all costs." One of those sentences tells you whether your business is working.
ROAS vs profit: What to do next
Here's the honest takeaway: ROAS is a useful input, not a final answer. It belongs in your toolkit, but it can't be your primary success metric — especially if you're running a tight-margin business or scaling aggressively.
The merchants who build sustainable Shopify stores are the ones who know their numbers below the revenue line. They know their break-even ROAS, their net profit per order, and what happens to those numbers when ad costs rise by 20%.
Getting that visibility is where the roas vs profit gap actually gets closed. It requires pulling together Shopify data, ad platform spend, COGS, and real fulfillment costs into one view — which is exactly what Shopimize is built to do. Instead of toggling between your ad dashboard and Shopify reports and a spreadsheet, you get one clear number: what you actually made.
Frequently asked questions
What is a good ROAS for Shopify stores?
There's no single answer — it depends entirely on your margins. A 3x ROAS could be very profitable for a high-margin product and deeply unprofitable for a dropshipped item with thin margins. Calculate your break-even ROAS first (1 ÷ your net margin before ad spend), then set your targets from there.
Can a high ROAS mean you're losing money?
Yes. If your product has high COGS, expensive shipping, significant return rates, or heavy transaction fees, even a 4x or 5x ROAS might not cover all your costs. ROAS only measures revenue relative to ad spend — it ignores everything else that affects your profit.
What should I track instead of ROAS?
Track net profit per order, cost per acquisition (CPA), and contribution margin. These numbers account for all your costs — not just ad spend — and give you a true picture of whether your advertising is building a profitable business. ROAS is still useful as a directional signal, but it shouldn't be your primary decision-making metric.
How do I calculate my break-even ROAS?
Divide 1 by your net margin before ad spend. For example, if your product sells for $50, costs $20 to produce, $6 to ship, and $1.75 in fees, your gross margin before ads is ($50 - $27.75) / $50 = 44.5%. Your break-even ROAS is 1 ÷ 0.445 = 2.25x. Any ROAS above that means you're making money; below it, you're losing money on every ad-driven sale.