
How to find your most (and least) profitable products
Most store owners know their best-selling products. They can tell you the SKU, the average order value, the conversion rate. What they often can't tell you is which products are actually making them money.
Those two things — best-selling and most profitable — are rarely the same. In fact, some of the most profitable Shopify products in a store are mid-volume sellers that nobody's tracking carefully. And some of the "heroes" driving the most revenue are quietly destroying margin with every order.
This article is about finding both: the products quietly making you money, and the ones costing you more than you realize.
What "most profitable product" actually means
A profitable product isn't just one that sells well or has a high price. True product profitability means what's left after you subtract everything it costs to get that product into a customer's hands — and keep it there.
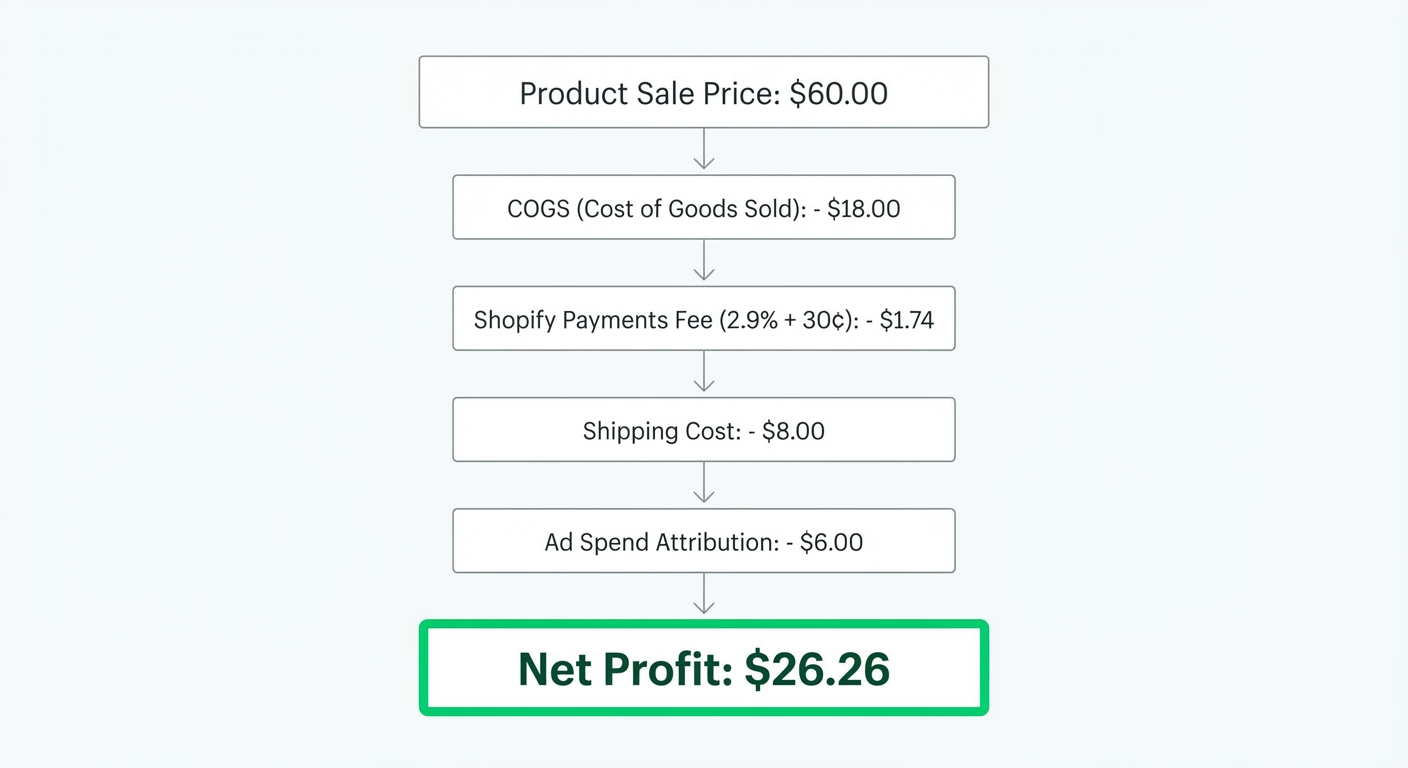
That includes the cost of goods sold (COGS), Shopify transaction fees, payment processing fees, shipping costs, packaging, and any ad spend attributed to that product. What's left is your real profit per unit. That number tells you far more than revenue ever will.
Why your revenue report is lying to you
Shopify's built-in analytics will show you which products generate the most revenue. That's a useful starting point, but revenue without context is dangerous.
Here's a real scenario: a store selling home goods has two products. Product A — a $120 wall mirror — sells 80 units a month. Product B — a $35 candle set — sells 200 units a month. On revenue alone, Product B looks like the star: $7,000 versus $9,600. But what if Product A costs $22 to make, ships for $6, and converts from organic traffic? And Product B costs $14 to make, ships for $7, but every single unit is sold through paid Facebook ads with a $9 average cost per acquisition?
Product A net profit per unit: roughly $86 (minus fees). Product B net profit per unit: roughly $5 after COGS, shipping, and ad spend.
Same store. Completely different picture once you look at actual profit.
The five costs that most store owners miss
When most merchants try to calculate product profitability, they stop at COGS. That's a start — but it's only part of the picture.
1. Shopify Payments processing fees
If you're on the Basic Shopify plan, you're paying 2.9% + $0.30 per transaction. On a $60 order, that's $2.04 — before you've touched anything else. Across 500 orders a month, that's over $1,000 gone. These fees vary by product price, so they hit low-margin, low-ticket products disproportionately hard.
See Shopify's current pricing and transaction fee structure for the full breakdown by plan.
2. Per-unit shipping costs
Flat-rate or free shipping offers feel great for conversion — and terrible for profitability on heavy or bulky products. If you're offering free shipping on all orders but one product weighs three times more than your average item, you're effectively subsidizing that SKU with margin from everything else.
3. Product-level ad spend
Not every product drives the same return on ad spend. If you're running Facebook or Google ads, your blended ROAS hides what's actually happening at the SKU level. A product with a 4x blended ROAS might have one SKU at 7x and another at 1.5x — and the 1.5x is killing your overall numbers.
4. Returns and refund rates
Some categories — apparel especially — have return rates above 20%. If you're not attributing return processing costs back to the product, you're overstating profitability on your worst offenders.
5. Packaging and inserts
Branded packaging, tissue paper, thank-you cards — these aren't free. If you've invested in the unboxing experience, that cost should live somewhere in your per-unit math. Most store owners put it in overhead and forget about it entirely.
Track this automatically
Shopimize shows your real profit per order, per product, per channel.
Try Shopimize free →How to calculate product-level profit: a step-by-step approach
Here's how to actually run the numbers on your products. This is worth doing manually for your top 10 SKUs at minimum.
Step 1: Pull your COGS for each SKU
Your supplier invoice is the floor. Add any import duties, quality inspection costs, or prep fees your 3PL charges per unit.
Step 2: Add per-unit shipping cost
If you're using a carrier like USPS or UPS, pull your average actual cost per shipment for that product — not your flat rate. Your shipping dashboard or 3PL invoice will have this.
Step 3: Calculate your payment processing fee
Take your average selling price for that SKU and apply 2.9% + $0.30 (for Shopify Payments on Basic). Adjust if you're on a higher plan.
Step 4: Attribute ad spend
This is the hard part. Divide your total spend on campaigns promoting that product by the number of units sold from those campaigns. If a product isn't directly advertised, apply a proportional share of your brand awareness spend.
Step 5: Subtract everything from the sale price
What's left is your net profit per unit. Multiply by monthly units sold to get monthly net profit by product.
Step 6: Sort and compare
Rank your products by net profit per unit and by total monthly net profit. You'll almost certainly be surprised by what you see.
The summary: your most profitable Shopify products aren't always your top sellers — they're the ones where the math works after every cost is accounted for.
You can run these numbers faster with our free profit calculator — plug in your COGS, fees, and shipping to see real margin instantly.
What product profitability analysis usually reveals
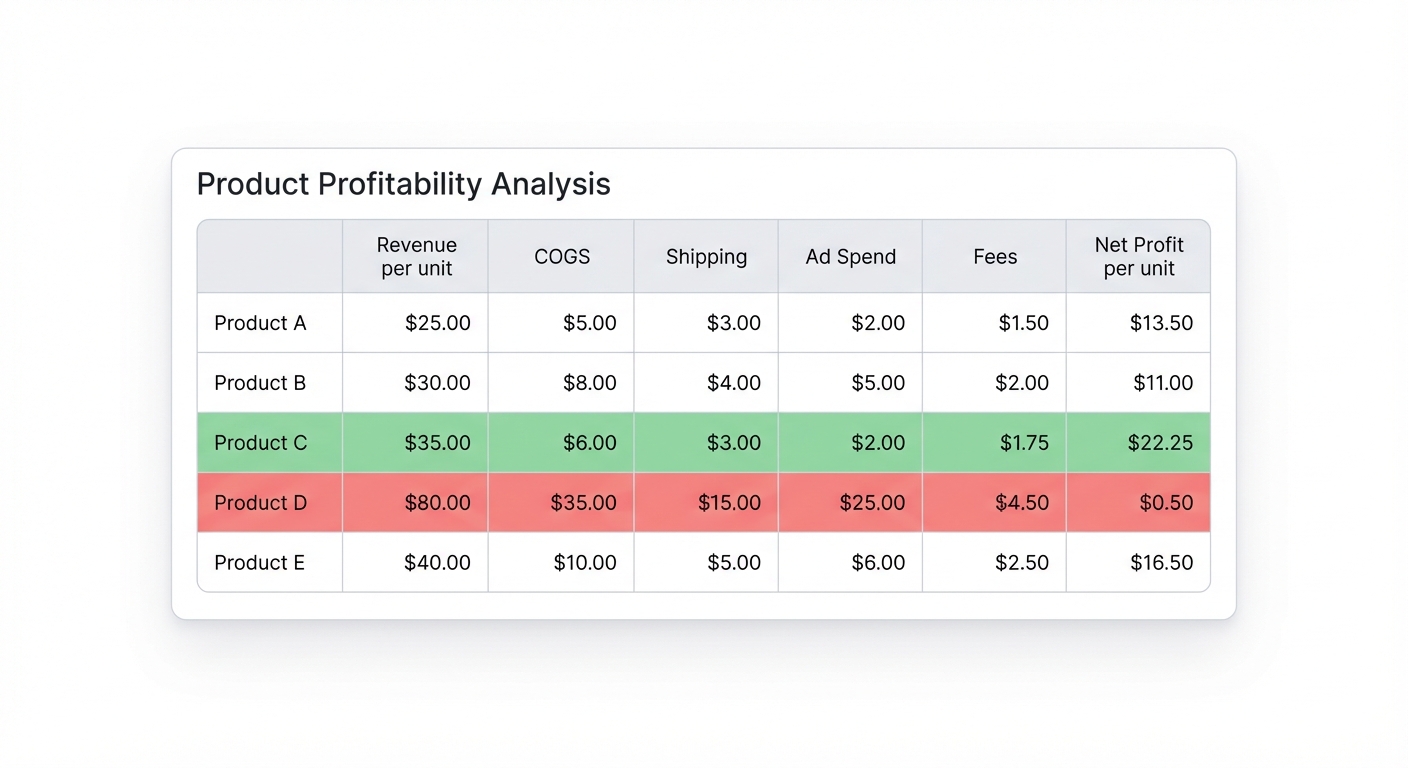
When store owners actually run this exercise, a few patterns come up again and again.
The high-revenue trap. The product driving the most revenue is often mid-margin or worse because it's the one with the most ad spend behind it. It looks like a star because the business is funding it. Without the ads, it might not sell at all — and with the ads, it barely breaks even.
The quiet winner. There's almost always a product with strong organic demand, low COGS, and no ad spend. It's been there the whole time. It never gets promoted because it doesn't "need" to be. But it's the most profitable Shopify product in the store, and most owners find it by accident.
The bundle trap. Sometimes a bundle sells well and looks profitable in aggregate — but one item in the bundle has terrible margins. The bundle math only works if you can negotiate COGS down on that item or remove it entirely.
The seasonal problem. Some products are profitable in Q4 and loss-making the rest of the year once you account for storage and ad spend during off-peak months. Annual profit-per-unit averages hide this completely.
Finding your least profitable products
The goal here isn't to cut everything that's struggling. Some low-margin products serve a real purpose — they're entry points into your brand, or they bundle with high-margin items. The goal is to know.
Here's what to look for:
- Products with net margin below 15% after all costs
- Products where refund rate is above 15%
- Products that only sell with heavy discounting
- Products where ad spend per unit sold exceeds $15 on a sub-$50 item
- Products with a return rate that's two or more times your store average
None of these are automatic death sentences. But if a product hits three or more of these, it deserves serious scrutiny — either you renegotiate COGS, stop promoting it, or phase it out.
How to act on what you find
Once you have a ranked list of products by true net profit, there are four levers you can pull.
Double down on winners. If a product has strong margins and organic demand, that's where ad spend makes sense. You're adding paid fuel to a profitable fire, not subsidizing a bad product.
Fix the fixable. A product with decent demand but thin margins might be one COGS negotiation away from being genuinely profitable. If you're ordering 200 units a month, your supplier may have room to move. Even a $2 reduction on COGS can shift a product from 8% margin to 14%.
Bundle strategically. Pair a low-margin product with a high-margin one. The bundle price can be set to protect your overall margin while giving the customer a perceived deal.
Cut the dead weight. Some products are just wrong for your catalog at this stage. Holding inventory on low-margin, low-turn items ties up cash you could use on products that actually work.
Why doing this manually only gets you so far
The exercise above is valuable. Do it. But it has a shelf life of about a week before your ad costs shift, a supplier invoice changes, or you run a promotion that moves margin around.
That's the fundamental problem with spreadsheet-based profitability tracking: it's a snapshot. Real profit moves constantly.
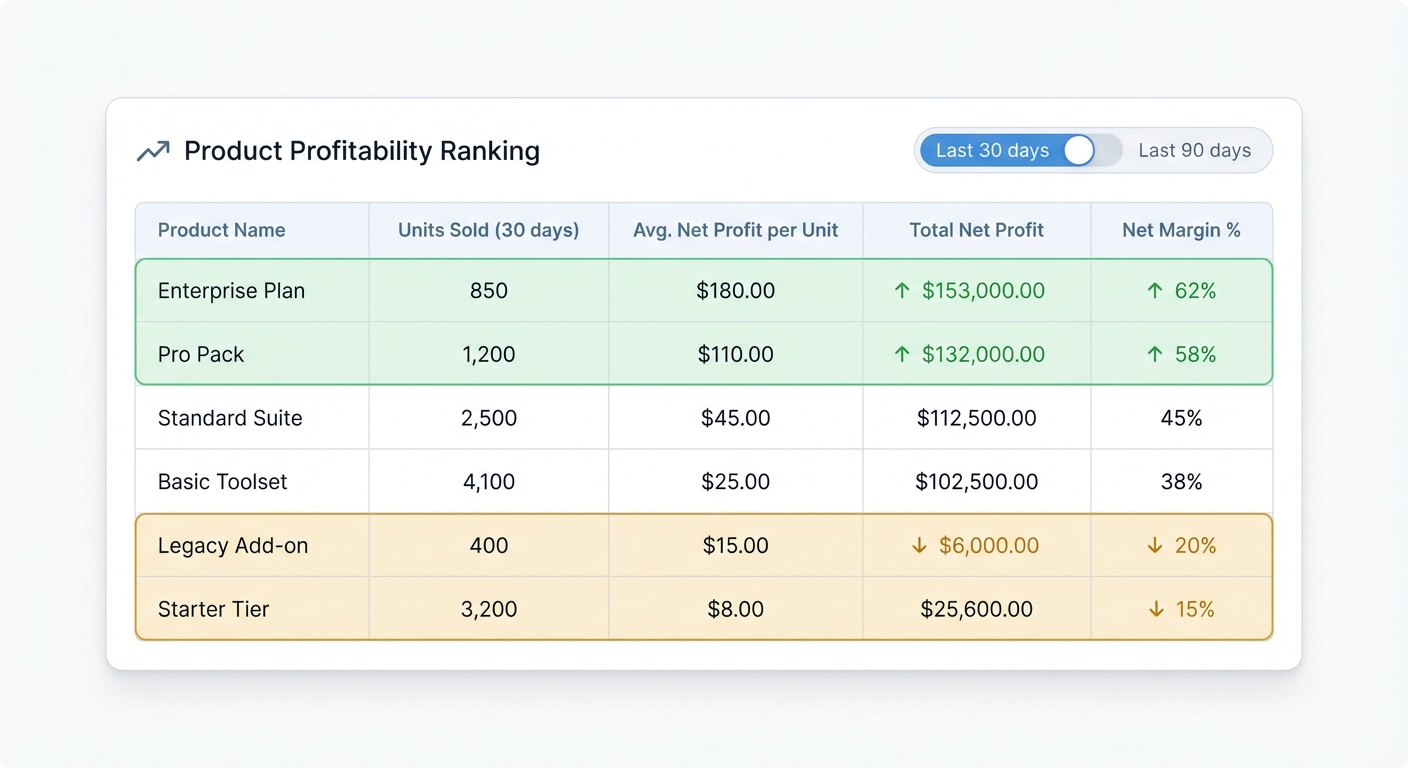
What you actually need is a live view — something that pulls your Shopify orders, applies your COGS, accounts for fees, and tells you which products are profitable right now. Not last month.
Knowing your most profitable Shopify products changes how you run everything
Once you genuinely know which products make you money, your decisions compound. You spend ad budget more precisely. You negotiate COGS with actual data. You know which products to feature in email campaigns and which ones to quietly retire.
The stores that grow profitably aren't just selling more — they're selling more of the right things. And finding your most profitable Shopify products is where that starts.
Shopimize is built exactly for this. It connects to your Shopify store, pulls in your real costs, and shows you per-product profitability — updated daily, without a spreadsheet in sight. If you're ready to stop guessing which products are actually working for you, it's worth a look.
Frequently asked questions
What makes a product truly profitable on Shopify?
A truly profitable product covers all its direct costs — cost of goods sold (COGS), shipping, transaction fees, and any ad spend attributed to it — and still leaves a meaningful margin. Revenue alone doesn't tell you this. A product selling for $80 with $65 in combined costs has a net profit of $15 and a margin of 18.75%, which is a real number worth knowing.
How do I find which Shopify products have the highest margin?
Shopify's native analytics don't calculate true margin by product — they show revenue and (if you've entered them) COGS, but don't factor in shipping, fees, or ad spend. The most accurate method is to calculate net profit per unit manually for each SKU using all direct costs, or use a profit analytics tool that does this automatically from your store's data.
Should I cut products with low profit margins?
Not automatically. Some low-margin products play a role in acquisition or bundling strategy. The question to ask is: does this product contribute to total store profit, or is it actively diluting it? A product with a 10% margin that drives high volume and leads customers to reorder higher-margin items might be worth keeping. A product with a 5% margin and a 25% return rate almost certainly isn't.
How many products should I analyze for profitability?
Start with your top 10 to 15 by revenue. In most stores, this covers 70-80% of total sales volume. Run the full cost breakdown on each — COGS, shipping, fees, ad spend, returns. Then sort by net profit per unit and total monthly net profit. What you find in that top tier will tell you most of what you need to know about where your profit is actually coming from.