
Google Ads for Shopify: Tracking Real Profit, Not Just ROAS
You're staring at your Google Ads dashboard. The numbers look amazing: 5x ROAS. $25,000 in conversion value from a $5,000 ad spend. You're celebrating with your team.
Then reality hits.
You pull your actual profit numbers from Shopify and QuickBooks. After accounting for cost of goods sold, shipping costs, payment processor fees, and refunds, those ads only generated $3,200 in actual profit. That's a 0.64x return on ad spend — or 64 cents of profit for every dollar you spent.
The math didn't break. Google's dashboard isn't lying. But it's not telling you the whole story either.
This is the profitability gap that's hiding in plain sight for thousands of Shopify brands running Google Ads campaigns. And if you're making budget decisions based on ROAS alone, you're flying blind.
Why Google Ads ROAS Doesn't Equal Profit
Let's be honest: Google's reporting is designed to make your campaigns look good. That's not malice — it's just how the platform is built. Google tracks conversion value (revenue), not profit. And there's a meaningful difference.
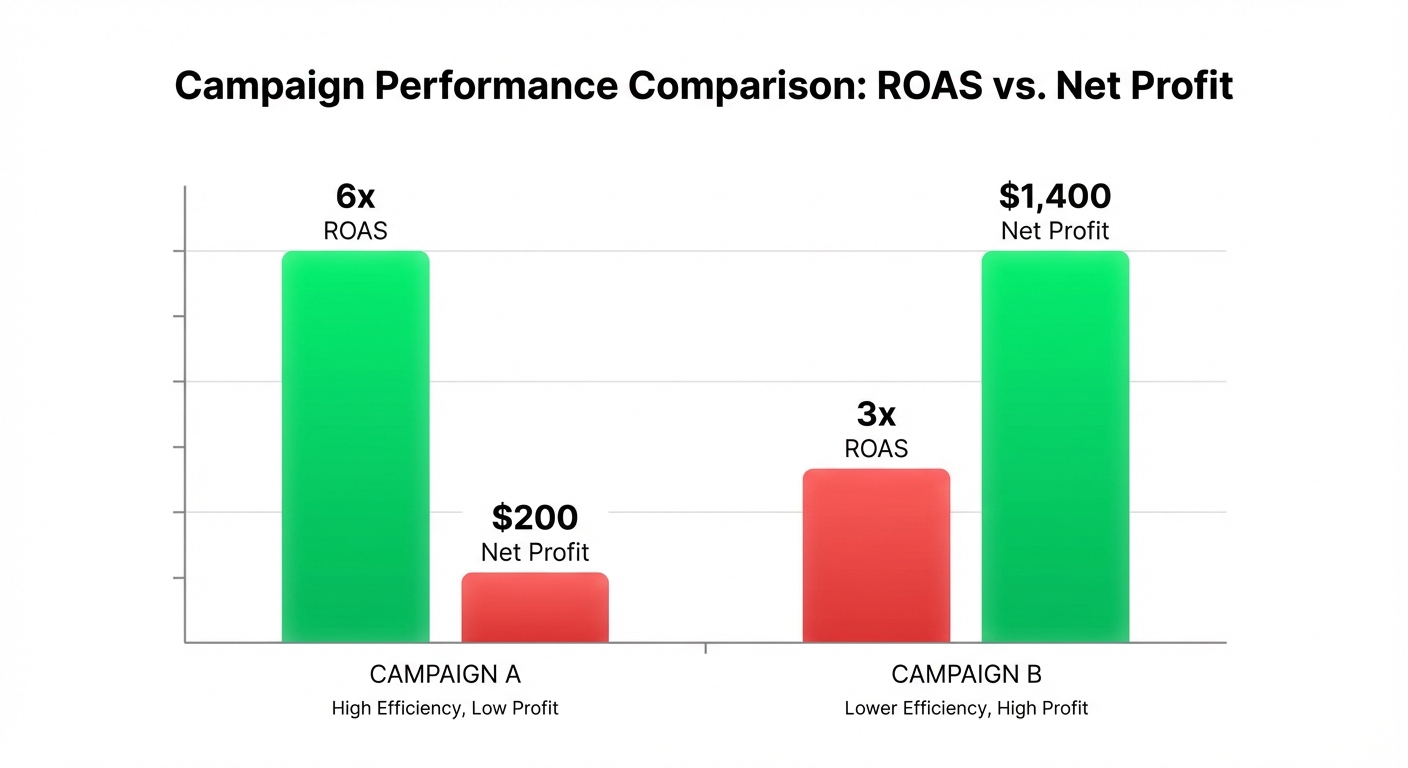
Here's what Google sees:
- Customer lands on your store
- Customer buys something
- Google captures the revenue and marks it as a "conversion"
Here's what Google doesn't see:
- Cost of goods sold (COGS) — the actual product cost
- Shipping and fulfillment fees
- Payment processing fees (Stripe, PayPal, etc.)
- Refunds and chargebacks
- Customer service costs
- Platform fees (Shopify subscription, apps)
- Overhead allocated to that sale
When you subtract all of these from revenue, what you're left with is actual profit. And that number is usually dramatically smaller than what Google reports.
The Real Math: A $5K/Month Google Ads Campaign
Let's walk through a realistic example. Say your Shopify store spends $5,000 per month on Google Ads.
What Google Ads shows you:
- 500 conversions
- $25,000 in conversion value (revenue)
- 5x ROAS
What your actual books show:
- Average order value: $50
- Average COGS per order: $15
- Shipping cost per order: $6
- Payment fees (2.2% + 30¢): $1.40
- Refund rate: 8% (40 orders refunded)
- Shopify + app fees allocated: $3 per order
The profit calculation for each order:
- Revenue: $50.00
- COGS: -$15.00
- Shipping: -$6.00
- Payment fees: -$1.40
- Allocated platform fees: -$3.00
- Profit per order: $24.60
But wait — 8% of orders are refunded, so 40 of your 500 orders don't generate profit. That's:
- Profitable orders: 460
- Total profit from 500 orders: 460 × $24.60 = $11,316
Actual ROAS: $11,316 ÷ $5,000 = 2.26x
Google shows you 5x. Reality is 2.26x.
And that's before you factor in:
- Repeat customer discount (some of these "conversions" are existing customers who would've bought anyway)
- Brand searches that Google claims credit for
- Incremental business that Performance Max actually drives vs. what would've happened organically
[IMAGE PLACEHOLDER: Chart showing "Google ROAS vs. Actual Profit ROAS" with two bars — one at 5x labeled "What Google Shows" in green, one at 2.26x labeled "What Actually Happened" in orange]
The Three Campaign Types and Their True Profitability
Google Ads campaigns aren't all created equal when it comes to profit. The profitability profile depends on the campaign type, audience intent, and attribution reality.
Search Ads: Highest Intent, Best Margins
Search ads are the closest thing to a "truth serum" in Google Ads. When someone types "best winter boots for women," they're ready to buy. They're searching for a solution.
Profitability profile:
- Highest customer intent
- Lowest attribution questions (they found you when searching for what you sell)
- Best conversion quality
- Most profitable orders
Typical ROAS gap: 10-20% between Google's reported ROAS and actual profit ROAS
Why the gap exists: Refund rates are still there. Payment fees are still there. Some of your ad spend goes to brand searches (people would've bought anyway).
Best for: Direct response. Profit-conscious merchants.
Shopping Ads: Volume With Moderate Margins
Shopping ads show product images, price, and ratings directly in search results. They drive high volume because they're visual and interrupt the search experience.
Profitability profile:
- Good conversion volume
- Moderate customer intent (they see an image, not necessarily looking for your brand)
- Higher refund rates (impulse purchases)
- Moderate margins after accounting for returns
Typical ROAS gap: 25-40% between Google's reported ROAS and actual profit ROAS
Why the gap is bigger: Visual interruption drives more window shopping. Refund rates are higher. Lower average order values.
Best for: Product-based stores with strong unit economics.
Performance Max: Black Box Volume
Performance Max is Google's AI-driven campaign type. You give it a daily budget and conversion goal. Google does the rest — across Search, Display, YouTube, Gmail, and Google Maps.
Profitability profile:
- Highest volume
- Lowest visibility into where money goes
- Highest risk of attribution problems
- Hardest to measure true profitability
Typical ROAS gap: 40-60% between Google's reported ROAS and actual profit ROAS
Why the gap is massive: You can't see which channels are driving what. Google's attribution model is generous (it gives credit to Performance Max for conversions that would've happened organically). Brand searches get lumped in. You have no control over the mix.
Best for: Scale. Not profit-conscious operations.
[IMAGE PLACEHOLDER: Table showing "Campaign Type Comparison" with columns for Campaign Type, Customer Intent, Volume, Profit ROAS Gap, Best For]
The Attribution Problem: Google's Generous Counting
Here's something that keeps many DTC brands awake at night: Google's attribution model assumes that if someone clicks on a Google Ad at any point before converting, Google gets credit for the entire sale.
This creates a few problems:
1. Brand Searches
Someone types your brand name in Google. They click your brand search ad. They buy.
Google counts this as a conversion driven by your ad spend. But here's the thing: they would've bought anyway. They already knew your brand. They were actively searching for you.
Your ad just intercepted a transaction that was going to happen.
2. The Last-Click Attribution Trap
A customer sees your Display ad. Doesn't click. Thinks about it for three days. Then searches your brand name and clicks the brand search ad.
Google gives 100% credit to the last click (brand search). But your Display impression might have driven the initial awareness.
This matters because brand search ads are cheap to run (high quality score, high CTR). Shopping ads are medium-cost. Display is very cheap but drives awareness, not direct conversions.
If you're measuring profit, you want to know: did Display ads drive $10 in profit or -$2? Attribution models hide this.
3. The Organic Search Problem
You rank #3 for a competitive keyword. Someone searches it, sees your organic result, ignores it. Keeps scrolling. Sees your Google Ad #1. Clicks the ad. Buys.
Google claims 100% credit. But your organic presence already gave you a visitor. The ad just redirected them to a paid path.
Track this automatically
Shopimize shows your real profit per order, per product, per channel.
Try Shopimize free →How to Calculate Real Profit From Google Ads
If Google's numbers aren't telling the full story, how do you actually measure profitability? You need to shift from "ROAS" (revenue-based) to "Profit ROAI" (profit-based).
Step 1: Calculate Profit Per Order
This is your foundation. You need to know exactly how much profit each order generates on average.
Formula:
`
Profit per Order = AOV - COGS - Shipping Cost - Payment Fees - Refund Impact - Platform Overhead
`
Example (from earlier):
- AOV: $50
- COGS: -$15
- Shipping: -$6
- Payment fees: -$1.40
- Platform overhead: -$3
- Profit per order: $24.60
If your refund rate is 8%, adjust this down:
- Profit per order (after refunds): $24.60 × 0.92 = $22.63
Step 2: Calculate Profit Per Click
This is powerful because it works with Google Ads data you already have.
Formula:
`
Profit per Click = (Conversions ÷ Clicks) × Profit per Order
`
Example:
- 5,000 clicks on a campaign
- 500 conversions
- Conversion rate: 10%
- Profit per order: $22.63
- Profit per click: 0.10 × $22.63 = $2.26
If you spent $5,000 on those 5,000 clicks:
- Cost per click: $1.00
- Profit per click: $2.26
- Actual return: $2.26 per $1 spent
Step 3: Calculate Profit Per Conversion
This is the equivalent of Google's "cost per conversion," but anchored to actual profit instead of revenue.
Formula:
`
Profit per Conversion = Profit per Order - Cost per Conversion
`
Example:
- Profit per order: $22.63
- Cost per conversion (ad spend ÷ conversions): $5,000 ÷ 500 = $10
- Profit per conversion: $22.63 - $10 = $12.63
You can build this backward too. If you know:
- Profit per order: $22.63
- Target profit per conversion: $10
Then your max sustainable cost per conversion is $12.63. Anything above that is eating into your profit.
Step 4: Track Campaign-Level Profitability
Now map these metrics by campaign.
| Campaign | Spend | Conversions | CPA | Profit/Order | Profit/Conv | Total Profit | Profit ROAS |
|---|---|---|---|---|---|---|---|
| Search - Boots | $2,000 | 180 | $11.11 | $22.63 | $11.52 | $2,073 | 1.04x |
| Shopping - Dresses | $1,500 | 120 | $12.50 | $20.00 | $7.50 | $900 | 0.60x |
| Perf Max | $1,500 | 200 | $7.50 | $18.00 | $10.50 | $2,100 | 1.40x |
| Total | $5,000 | 500 | $10.00 | $20.81 | $10.81 | $5,073 | 1.01x |
Notice: Perf Max has the lowest CPA but so does overall profitability because conversion quality is lower (refund rates matter here). Search Boots is your profit engine.
This is the data Google doesn't show you.
Practical Setup: Connecting Google Ads to Profit Tracking
Knowing this is one thing. Implementing it is another. Here's how to start:
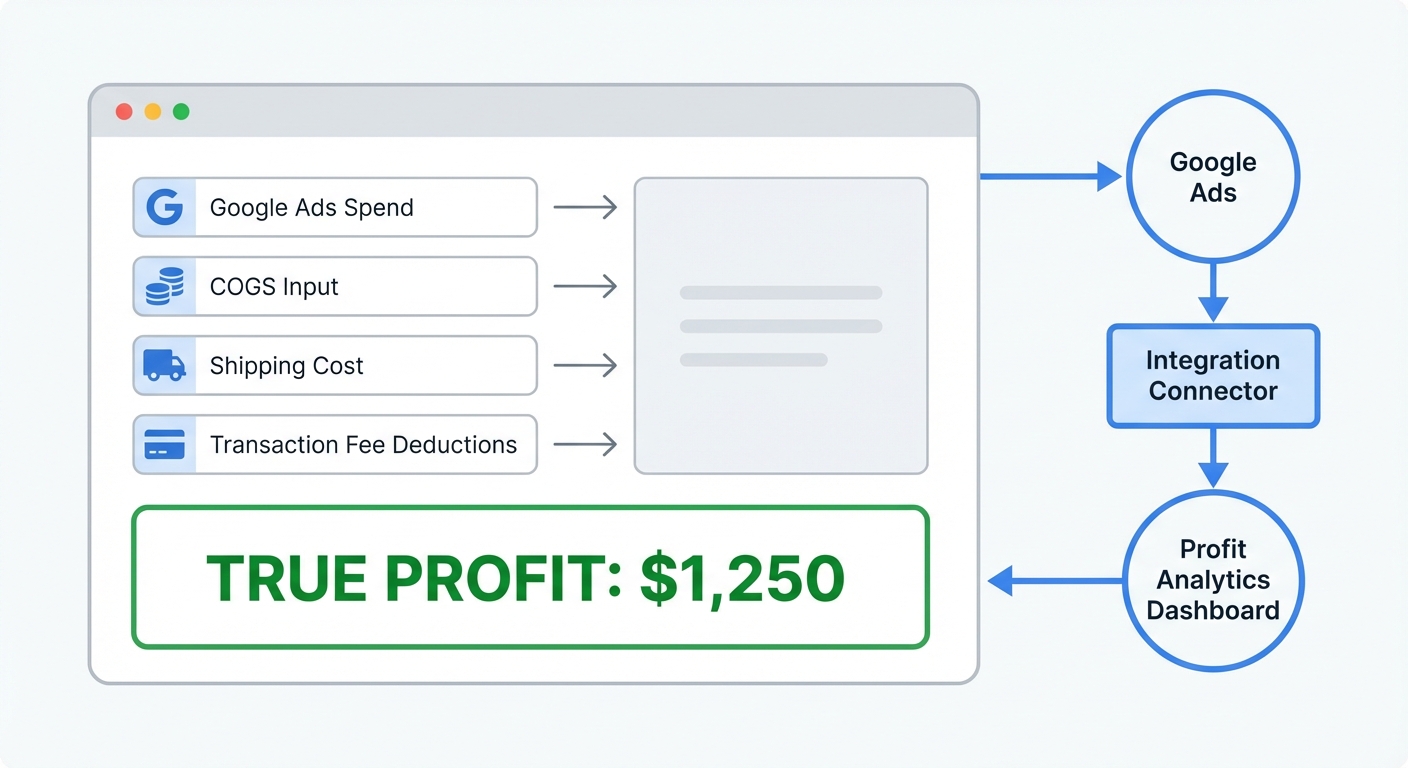
1. Export Your Cost Data
Pull your Google Ads spending by campaign, ad group, and keyword (if possible). You need:
- Campaign name
- Ad spend
- Conversions
- Conversion value (to track against what Google says)
Google Ads API and Google Sheets integrations (like OWOX BI or Supermetrics) can automate this.
2. Import Shopify Order Data
Pull your actual order data from Shopify (order value, refunds, customer data). You need:
- Order ID
- Revenue
- COGS per order
- Refund status
- Customer lifetime value (if available)
Shopify's built-in reports or apps like Shopimize help here.
3. Calculate Profit Per Order
Use Shopify's data to calculate:
- Revenue per order
- Average COGS
- Average shipping cost
- Payment fees (usually 2.2% for Stripe)
- Refund rate
Store this as a baseline number that updates monthly.
4. Attribution: Tag Your Orders
This is critical. When an order comes in, tag it with the traffic source that drove it. Shopify's UTM parameters help here.
- utm_medium=cpc (from Google Ads)
- utm_campaign=search-boots
- utm_content=brand-search
This lets you attribute profit back to the specific Google Ads campaign that drove the order.
5. Dashboard It
Build a simple dashboard (Google Sheets, Looker, or tools like Shopimize) that shows:
- Campaign name
- Ad spend
- Conversions
- Profit per order
- Total profit
- Profit ROAS
Update this weekly. Watch for patterns. Ask questions:
- Which campaigns are actually profitable?
- Are any campaigns losing money?
- Is your best-performing campaign (by ROAS) actually your best profit generator?
[IMAGE PLACEHOLDER: Screenshot of a profit dashboard with campaign names, spend, conversions, and profit ROAS]
Common Mistakes (And How to Avoid Them)
Mistake 1: Ignoring Refunds
Refund rates vary wildly by product, season, and campaign type. A 5% refund rate on Search looks great. A 15% refund rate on Performance Max kills profitability.
Always bake in refund rates when calculating profit per order.
Mistake 2: Using Gross Margin Instead of Profit
Gross margin (Revenue - COGS) is useful, but it's not profit. Profit is revenue minus all costs, including shipping, fees, and overhead.
A 50% gross margin order isn't a win if you spent $15 in platform fees and shipping.
Mistake 3: Allocating Zero Platform Overhead
Shopify charges $300-2,000/month depending on your plan. Apps cost money. Hosting, email, analytics. These costs exist whether you run ads or not, but they still reduce profit.
Allocate a per-order portion ($2-5 depending on your plan) to campaigns.
Mistake 4: Trusting Google's Attribution
Google is generous with attribution. Don't assume every conversion it reports is truly driven by your ads.
Run a holdout test: pause a campaign for one week and measure the lift. That's your true incrementality.
Mistake 5: Not Segment by Campaign Type
Search, Shopping, and Performance Max have completely different profitability profiles. Lumping them together hides which channel is actually making money.
Always measure profit separately by campaign type.
FAQs
Q: Is a 2x profit ROAS good?
A: It depends on your industry and margins. For DTC brands, 1.5x-2x is sustainable. Less than 1x means you're losing money on ads. More than 3x means you're either very profitable or not capturing all your costs.
Q: How do I account for repeat customers?
A: Good question. If 30% of your conversions are repeat customers, they're less profitable on a per-order basis (lower AOV, different margins). Ideally, track profit for new vs. repeat customers separately.
Q: Should I pause campaigns with low profit ROAS?
A: Not necessarily. A campaign with 0.8x profit ROAS might be driving brand awareness that helps organic traffic. But yes, prioritize campaigns with positive profit ROAS if you're optimizing for profitability.
Q: What if my profit per order changes monthly?
A: It will. Seasonal fluctuations, sales, inventory changes — all shift margins. Recalculate monthly and adjust your campaigns accordingly.
Q: Can I use profit metrics inside Google Ads automation?
A: Not directly — Google Ads doesn't have access to your profit data. But you can manually adjust bids and budgets based on your profit analysis, or use third-party tools that integrate both platforms.
Q: Is Performance Max ever profitable?
A: Yes, if your refund rates are low and your product CAC is flexible. But visibility is the tradeoff — you'll never know exactly why it's working.
The Profit-First Mindset
Here's what separates profitable DTC brands from those spinning their wheels: they measure profit, not vanity metrics.
A 5x ROAS feels incredible. But if it's only a 1.5x profit ROAS, you're working twice as hard for half the return.
This doesn't mean you can't run Google Ads profitably. Thousands of Shopify brands do. But it means you need to:
- Know your true profit per order — down to the dollar
- Calculate profit metrics — profit per click, profit per conversion, profit ROAS
- Segment by campaign type — because not all Google Ads are created equal
- Question attribution — Google gives generous credit; don't take it at face value
- Optimize for profit, not ROAS — it's a different game
The brands that do this consistently outcompete those that don't. They know which ads are actually working. They adjust faster. They grow with confidence instead of hope.
Want to see your real profit from Google Ads — not just ROAS? Try Shopimize free and connect ad spend to actual profit per order.
Last updated: September 29, 2026