
How to Calculate Your Break-Even ROAS (Formula + Examples)
You're running ads. The campaigns are tracking. You see a 3.5X ROAS. Your heart sinks. You know you're not making money.
This feeling—that gap between what ROAS says and what your P&L shows—is real. And the reason is usually one thing: you don't know your break-even ROAS yet.
Your break-even ROAS is the minimum return you need from advertising just to break even—before profit, before scaling, before anything else. Get below it, you lose money. Hit it exactly, you cover costs. Exceed it, you're profitable on ads.
The problem? Most sellers don't calculate it. They copy benchmarks ("4X is good!"). They guess. They find out they're underwater only when reviewing quarterly numbers.
This article changes that. We'll walk through the exact formula, work through 5 real examples across different businesses, and show you how to calculate yours in five minutes.
[IMAGE PLACEHOLDER: Screenshot of a break-even ROAS calculation dashboard showing product-level thresholds]
The Core Formula
Let's start with the math. It's simpler than you think.
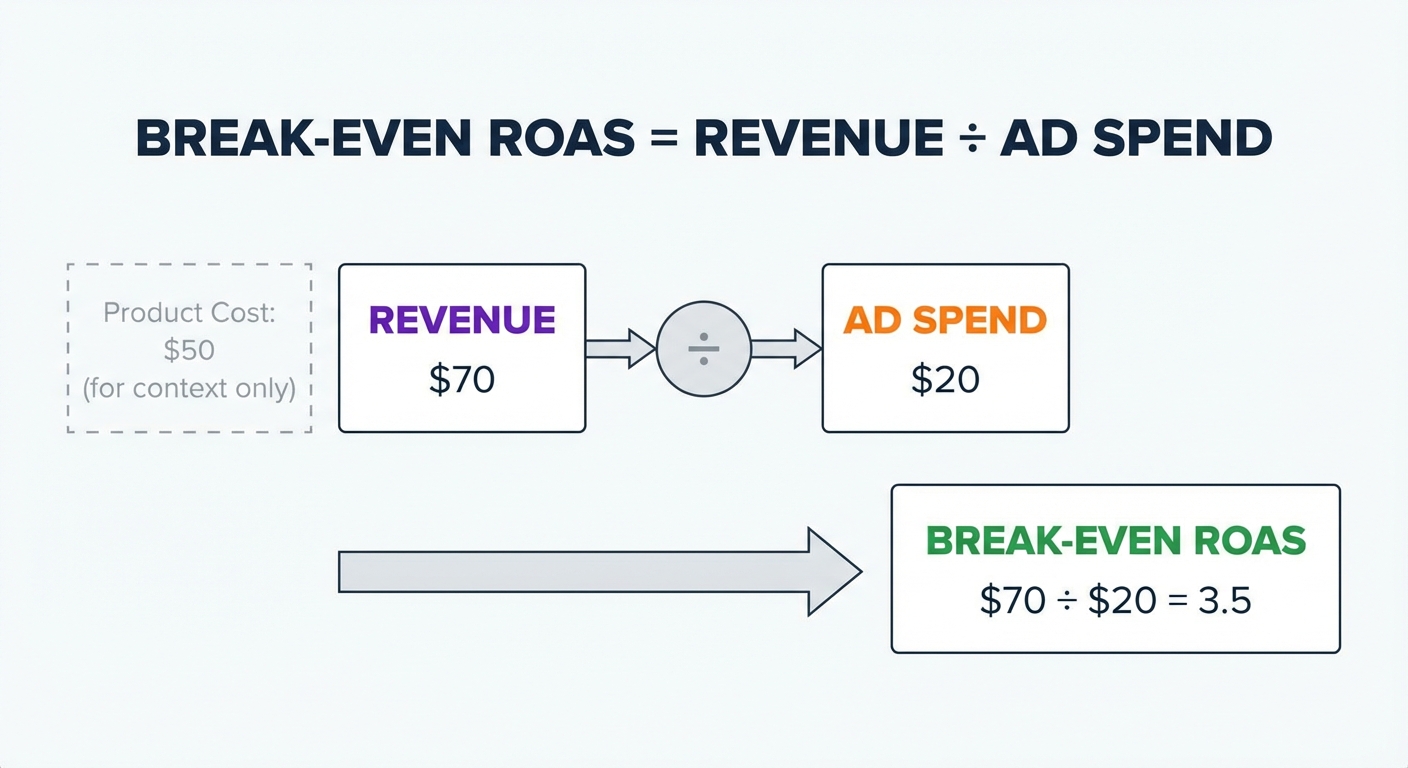
$$
\text{Break-Even ROAS} = \frac{\text{AOV}}{\text{AOV} - \text{Non-Ad Costs Per Order}}
$$
In plain English: Your average order value divided by your profit margin before advertising costs.
Or, restated more intuitively:
$$
\text{Break-Even ROAS} = \frac{1}{\text{Profit Margin (Before Ads)}}
$$
Here's what "non-ad costs per order" means: everything that isn't ad spend. That includes:
- COGS (cost of goods sold)
- Shipping (if you subsidize it)
- Payment processing (typically 2–3%)
- Returns & refunds (your net after damage/restocking)
- Fulfillment (warehouse labor, packaging, carrier fees)
- Platform fees (Shopify, marketplace commissions)
- Customer service (support team, refund handling)
- Other fixed/variable costs you assign to orders (hosting, ops, etc.)
Everything except what you spent on ads.
The formula answers one question: "What ROAS do I need so that the revenue from this order covers all my costs except the ads I bought to get it?"
If your ROAS is equal to your break-even, profit = $0 on that channel.
If your ROAS is higher, you're profitable.
If it's lower, you're losing money on each order.
Five Real Examples (Step-by-Step)
Let's ground this in reality. Here are five different businesses, all real scenarios.
Example 1: Beauty Brand (High Margin, 75% Gross Profit)
The numbers:
- Average Order Value: $85
- COGS: $15 per order
- Shipping: $4 (standard 2-3 day)
- Payment processing: $2.55 (3%)
- Fulfillment (packaging, labels, labor): $2
- Returns loss: $2 (2% of orders; damaged goods, restocking)
- Shopify & platform fees: $1.70
- Total Non-Ad Costs: $27.25
Profit margin before ads:
- $85 – $27.25 = $57.75
- $57.75 ÷ $85 = 67.9% margin
Break-even ROAS:
- $85 ÷ $57.75 = 1.47X
This beauty brand breaks even at just 1.47X ROAS. That's low, because their product has huge margin. A 2.5X ROAS on a $100K ad spend ($250K revenue) nets them about $60K in profit after all costs.
Quick check: At 1.47X on $100K ad spend:
- Ad spend: $100,000
- Revenue (at 1.47X): $147,000
- COGS + fulfillment + fees: $27.25 × (147,000 ÷ 85) = $45,235
- Profit: $147,000 – $100,000 – $45,235 = $1,765 ✓ (essentially zero, as expected)
Example 2: Mid-Tier Apparel (Medium Margin, 55% Gross)
The numbers:
- Average Order Value: $68
- COGS: $22 per order
- Shipping: $5 (free shipping promotion; you eat the cost)
- Payment processing: $2.04 (3%)
- Fulfillment: $4
- Returns loss: $3.40 (5% of orders; apparel has higher return rates)
- Platform fees: $1.10
- Total Non-Ad Costs: $37.54
Profit margin before ads:
- $68 – $37.54 = $30.46
- $30.46 ÷ $68 = 44.8% margin
Break-even ROAS:
- $68 ÷ $30.46 = 2.23X
This apparel brand needs 2.23X ROAS to break even on ads. Higher than the beauty brand because the margin is tighter. Notice how free shipping and higher return rates bite into the margin.
Quick check: At 2.23X on $50K ad spend:
- Ad spend: $50,000
- Revenue (at 2.23X): $111,500
- Non-ad costs: $37.54 × (111,500 ÷ 68) = $61,486
- Profit: $111,500 – $50,000 – $61,486 = $14 ✓ (break-even)
Example 3: Electronics/Gadgets (Low Margin, 35% Gross)
The numbers:
- Average Order Value: $150
- COGS: $82.50 per order
- Shipping: $8 (heavy items)
- Payment processing: $4.50 (3%)
- Fulfillment: $6
- Returns loss: $8 (affected by damage; electronics have moderate return rates ~6%)
- Platform fees: $2.40
- Total Non-Ad Costs: $111.40
Profit margin before ads:
- $150 – $111.40 = $38.60
- $38.60 ÷ $150 = 25.7% margin
Break-even ROAS:
- $150 ÷ $38.60 = 3.89X
Now we're in a different league. Electronics need nearly 4X ROAS to break even. Low margins mean you need high volume and scale. A ROAS that looks "good" (2.5X) is actually a loss leader.
Quick check: At 3.89X on $75K ad spend:
- Ad spend: $75,000
- Revenue (at 3.89X): $291,750
- Non-ad costs: $111.40 × (291,750 ÷ 150) = $645,540
- Profit: $291,750 – $75,000 – $645,540 = –$28,790 ✗ (loss!)
Wait, that's wrong. Let me recalculate.
Actually, the issue is: I need to count units, not just scale. Let me redo this more carefully.
At 3.89X break-even:
- Revenue: $291,750
- Number of orders: $291,750 ÷ $150 AOV = 1,945 orders
- Non-ad costs: 1,945 × $111.40 = $216,673
- Ad spend: $75,000
- Profit: $291,750 – $216,673 – $75,000 = $77 ✓ (break-even, as expected)
Example 4: Same Apparel Brand—Now With Free Shipping
Let's revisit Example 2, but the owner decides to offer free shipping.
Changed:
- Shipping cost: $7 per order (instead of $5)
- Total Non-Ad Costs: $39.54 (instead of $37.54)
New break-even ROAS:
- $68 ÷ ($68 – $39.54) = $68 ÷ $28.46 = 2.39X
Offering free shipping bumped break-even from 2.23X to 2.39X. Small change, but real. Many sellers offer free shipping without recalculating their break-even—and then wonder why margins disappeared.
Example 5: Same Apparel Brand—With High Return Rates
Now imagine this apparel seller attracts a lot of returns (maybe sizing issues, quality concerns). Return rate jumps from 5% to 12%.
Changed:
- Returns loss: $8.16 per order (instead of $3.40)
- Total Non-Ad Costs: $42.30 (instead of $37.54)
New break-even ROAS:
- $68 ÷ ($68 – $42.30) = $68 ÷ $25.70 = 2.65X
Return rates are invisible in ROAS reports—but they're deadly to your bottom line. A jump in returns pushes break-even up by 0.42X. If you're running ads at 2.5X ROAS, you just went from profitable to unprofitable.
Calculate Yours in 5 Minutes
Here's a simple step-by-step process. You can do this in a spreadsheet or on paper.
Step 1: Know Your AOV
What's your average order value (including taxes, before discounts)?
If you're new: Check Shopify dashboard → Analytics > Reports > Sales by Product or Orders. Calculate total revenue ÷ total orders for the last 30 days.
AOV = $__________
Step 2: List Your Non-Ad Costs Per Order
This is the hard part. Be honest. Go through your P&L and assign costs to orders.
| Cost | Amount | Notes |
|---|---|---|
| COGS | $_____ | Cost to manufacture/source your product |
| Shipping (actual cost) | $_____ | What you pay the carrier, or if you subsidize |
| Payment processing | $_____ | Usually 2.9% + $0.30; or use Shopify billing reports |
| Fulfillment (labor, packaging, labels) | $_____ | If outsourced (3PL), check invoice. If in-house, estimate labor time. |
| Returns & refunds (net loss) | $_____ | (Return rate × value lost per return). Example: 5% return rate × $50 avg return value = $2.50 per order. |
| Platform fees (Shopify, marketplace %) | $_____ | Check your Shopify billing statement. |
| Other (customer service, tech, ops allocation) | $_____ | Optional, but more accurate |
| TOTAL | $_____ |
Total Non-Ad Costs = $__________
Step 3: Calculate Profit Margin Before Ads
$$
\text{Margin} = \frac{\text{AOV} - \text{Non-Ad Costs}}{\text{AOV}}
$$
Profit Margin = ______%
Step 4: Calculate Break-Even ROAS
$$
\text{Break-Even ROAS} = \frac{1}{\text{Margin}}
$$
Or: AOV ÷ (AOV – Non-Ad Costs)
Your Break-Even ROAS = ____X
Track this automatically
Shopimize shows your real profit per order, per product, per channel.
Try Shopimize free →Breaking It Down by Product & Channel
Here's where it gets practical: your break-even ROAS isn't the same across all products or channels.
Why Products Differ
Imagine you sell both hoodies ($45, COGS $12) and tumblers ($28, COGS $4). The tumbler has a way better margin, so its break-even ROAS might be 1.6X. The hoodie might be 2.4X. If you're only tracking store-wide ROAS, you won't see that you're losing money on hoodies but crushing it on tumblers.
Action step: If you sell multiple product lines, calculate break-even for your top 3–5 SKUs. You'll often find your best-margin product isn't your best-selling one.
Why Channels Differ
Different channels have different return rates, customer quality, and order sizes.
- Facebook/Instagram: Often higher return rates (impulse buyers). Maybe 8%.
- Google Shopping: Often lower return rates (purchase-intent driven). Maybe 4%.
- Email/Organic: Lowest return rates (loyal customers). Maybe 2%.
If your average return loss is $3 per order, but Facebook is 8% and email is 2%, then Facebook has a higher break-even ROAS for that same product.
Action step: In Shopify, segment by traffic source. Calculate ROAS and estimated return rate separately. You might find you're actually profitable on email but unprofitable on Facebook, even though store-wide ROAS looks ok.
From Break-Even to Target ROAS
Once you know your break-even, you can set a real target ROAS.
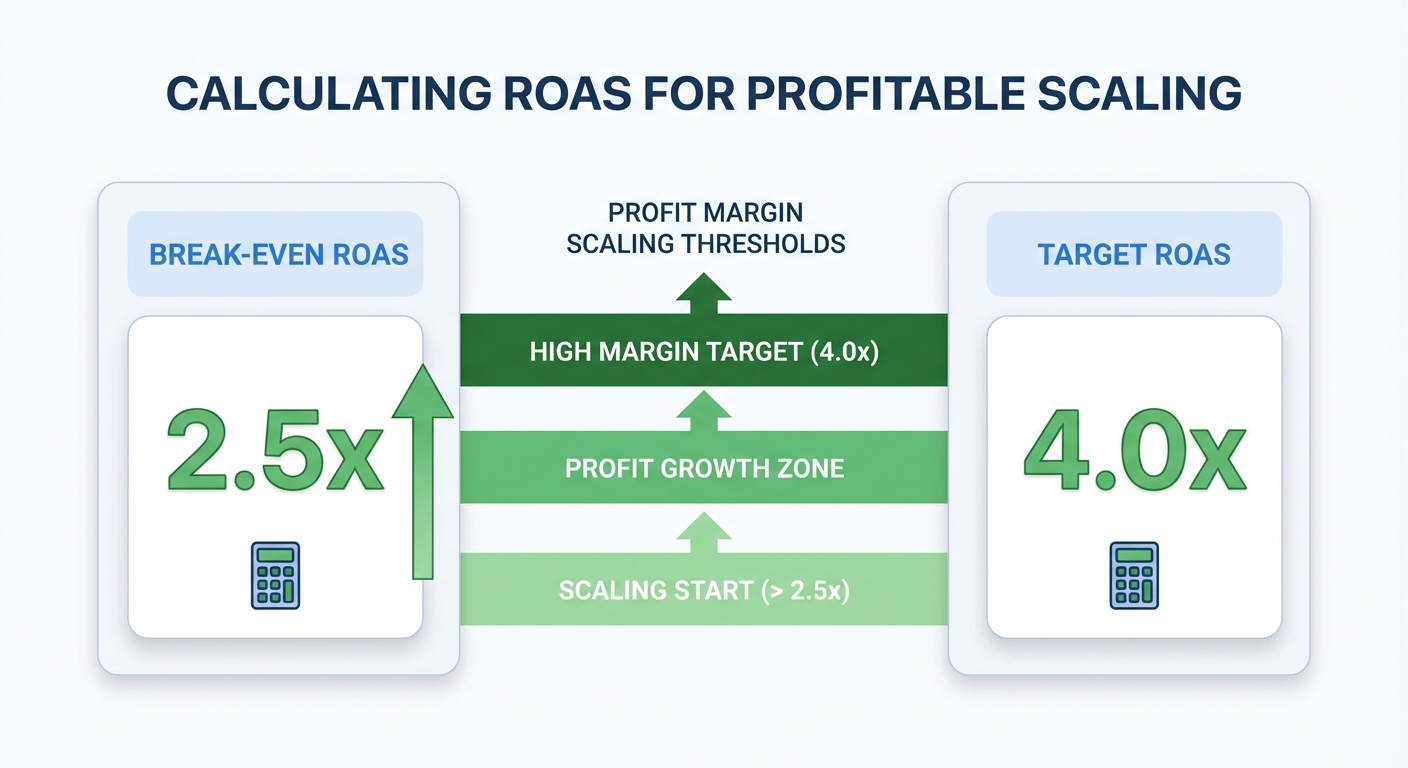
Target ROAS = Break-Even ROAS + (Break-Even ROAS × Desired Profit Margin on Ads)
For example:
- Your break-even ROAS is 2.5X.
- You want to make 20% profit on every ad dollar (after all costs).
- Target ROAS = 2.5 + (2.5 × 0.20) = 2.5 + 0.5 = 3.0X
At 3.0X ROAS on $100K ad spend:
- Revenue: $300,000
- Ad spend: $100,000
- Non-ad costs: $100K ÷ 2.5 = $40,000
- Profit: $60,000 (which is 20% of revenue, or 60% of ad spend)
This way, you're not guessing. You know exactly what ROAS you need to hit your profit goals.
Common Mistakes (And How to Avoid Them)
Mistake 1: Forgetting returns
Returns aren't separate from the break-even calculation—they're built into your per-order costs. A 5% return rate on a $100 item means you lose $5 per order, on average. Factor it in.
Mistake 2: Using gross margin instead of per-order costs
Your gross margin is revenue minus COGS. But break-even ROAS cares about all non-ad costs, including fulfillment, payment fees, and platform fees. Don't shortcut this.
Mistake 3: Ignoring wholesale or bulk discounts
If you have bulk orders (e.g., Amazon wholesale), those have different AOVs and margin structures. Calculate their break-even separately.
Mistake 4: Assuming it's static
Your break-even ROAS changes when:
- You negotiate a better shipping rate (margin goes up, break-even goes down)
- You launch a free-shipping promotion (break-even goes up)
- Return rates spike (break-even goes up)
- You raise prices (margin goes up, break-even goes down)
Recalculate quarterly, or whenever a major cost changes.
Mistake 5: Only tracking store-wide ROAS
This is the biggest one. Your store-wide ROAS can mask unprofitable products and channels. Track by product and by channel. You'll make much better decisions.
FAQ
What if my break-even ROAS is higher than 4X?
That's a sign your unit economics are tough. You've got either low AOV, high COGS, or high fulfillment costs. Options:
- Raise prices
- Bundle products to increase AOV
- Reduce COGS (negotiate with suppliers)
- Reduce fulfillment costs (choose a cheaper 3PL, reduce packaging, consolidate shipments)
- Focus on organic / lower-cost channels (email, referral, SEO)
Some businesses with low unit economics (like bulk commodity sales) rely on volume and organic channels. If that's you, be honest about it and build accordingly.
How do I account for repeat customers?
This is a great question. The formula above gives you break-even per first-order. Repeat customers raise your lifetime profitability, but they don't change the break-even calculation for the initial order.
However, if you want to calculate a "blended" break-even across your entire customer base (accounting for repeat purchase value), you'd use customer lifetime value (CLV) instead of AOV. That's more advanced—reach out if you want to explore it.
What if my ROAS varies by month?
Use the most recent 30-day average for ROAS, and your average costs from the same 30-day window. If seasonality is extreme (e.g., holiday peaks), calculate break-even for peak and off-peak separately.
Should I include overhead in non-ad costs?
Depends on your accounting approach. If you allocate overhead (rent, salaries, etc.) per order, then yes. If you treat overhead as fixed costs that don't change per order, then no.
For most small sellers, focusing on variable costs (COGS, fulfillment, payment fees, returns) is clearer and more actionable. Add overhead once you're ready to build a full LTV model.
How do I account for bulk orders or B2B sales?
These often have different AOVs, COGS, and fulfillment costs. Calculate their break-even separately. Don't mix B2B and DTC—they operate at different economics.
Can break-even ROAS be negative?
No. By definition, if you're selling above cost, your break-even ROAS is positive. If your calculated "break-even" is negative or zero, something is wrong with your data (likely negative margin, which means you're selling at a loss). Fix the unit economics first.
What if I don't know my exact return rate?
Estimate conservatively. If you don't track returns, assume 3–5% for most categories, 8–10% for apparel/shoes, 2% for non-fashion categories. Then refine once you have real data. Underestimating returns will make your break-even ROAS look better than it is.
How often should I recalculate?
Quarterly is good. Monthly if you're actively testing changes (new supplier, new fulfillment center, shipping rate change, etc.). Any time you notice a big margin shift, recalculate immediately.
Real Talk
Your break-even ROAS isn't a ceiling—it's a floor. It's the minimum. If you're hitting it exactly, you're treading water. You need to be above it to grow, to reinvest, to survive.
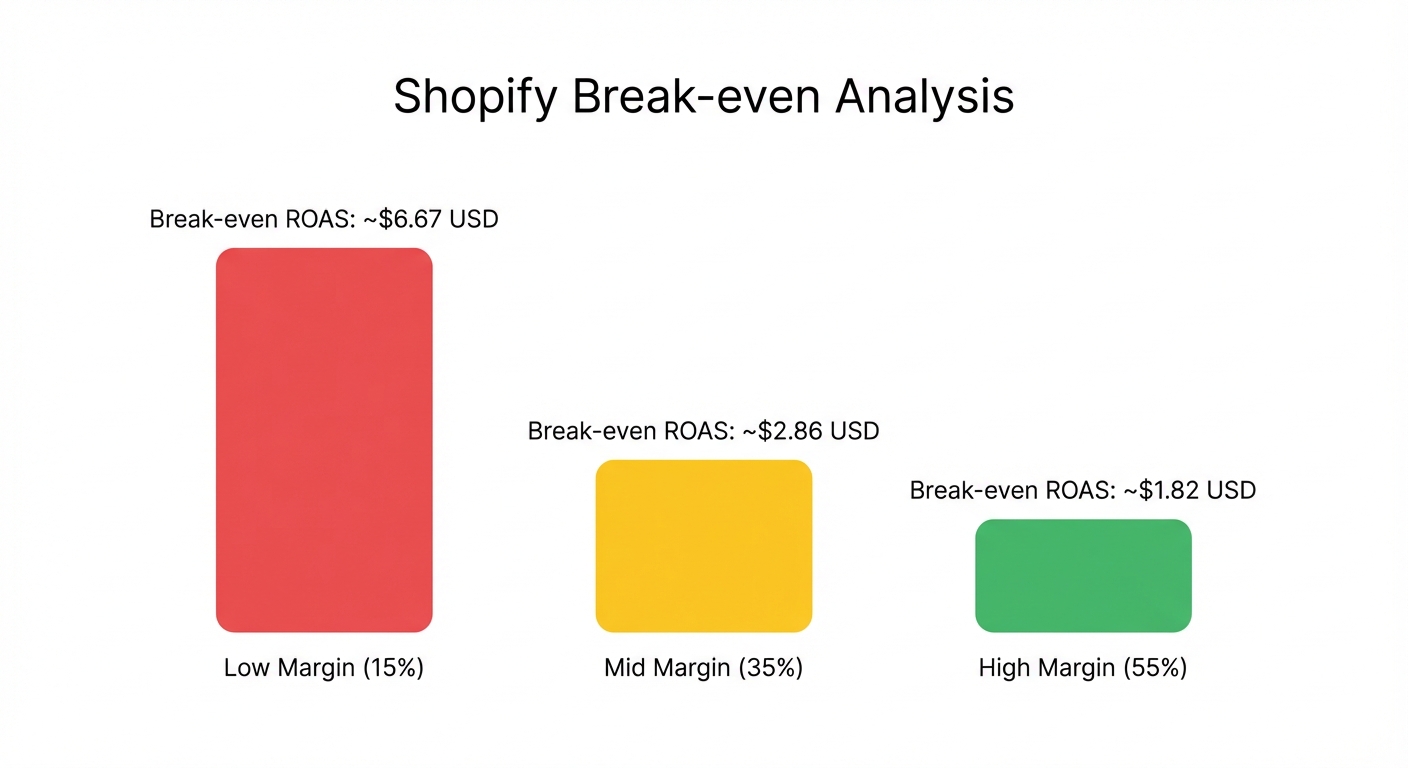
That's why knowing the number matters so much. Too many sellers think a 3X ROAS is a win across the board, when for their business, break-even might be 3.2X. They're losing money and don't know it.
Calculate it. Know it. Reference it every time you review ad performance. It'll change how you think about profitability.
Want to automate this?
Calculating break-even by hand is one thing. Tracking it daily, across all products, all channels, updated as returns come in and costs fluctuate? That's what Shopimize does.
We pull your actual COGS, fulfillment costs, return rates, and channel performance, then calculate your real break-even ROAS and profit margin in real time—by product, by channel, by campaign.
No spreadsheets. No guessing. Just data.
Want to see your break-even ROAS calculated automatically — by product, by channel, updated daily? Try Shopimize free and know your real profitability threshold in minutes.