
E-commerce Return Rates by Category: What They Actually Cost You
You already know returns hurt your bottom line. But here's what most sellers miss: a 25% return rate in apparel doesn't cost the same as a 25% return rate in beauty. The category matters more than the percentage.
We're going to walk through actual return rate benchmarks, the real costs hiding behind each return, and exactly how this impacts your annual profit. Then you'll know not just your return rate—you'll know what it's costing you.
[IMAGE PLACEHOLDER: Chart showing return rate comparison across categories]
Return Rates by Category: The 2026 Benchmark
Here's the honest picture of what e-commerce sellers are seeing right now across different product categories:
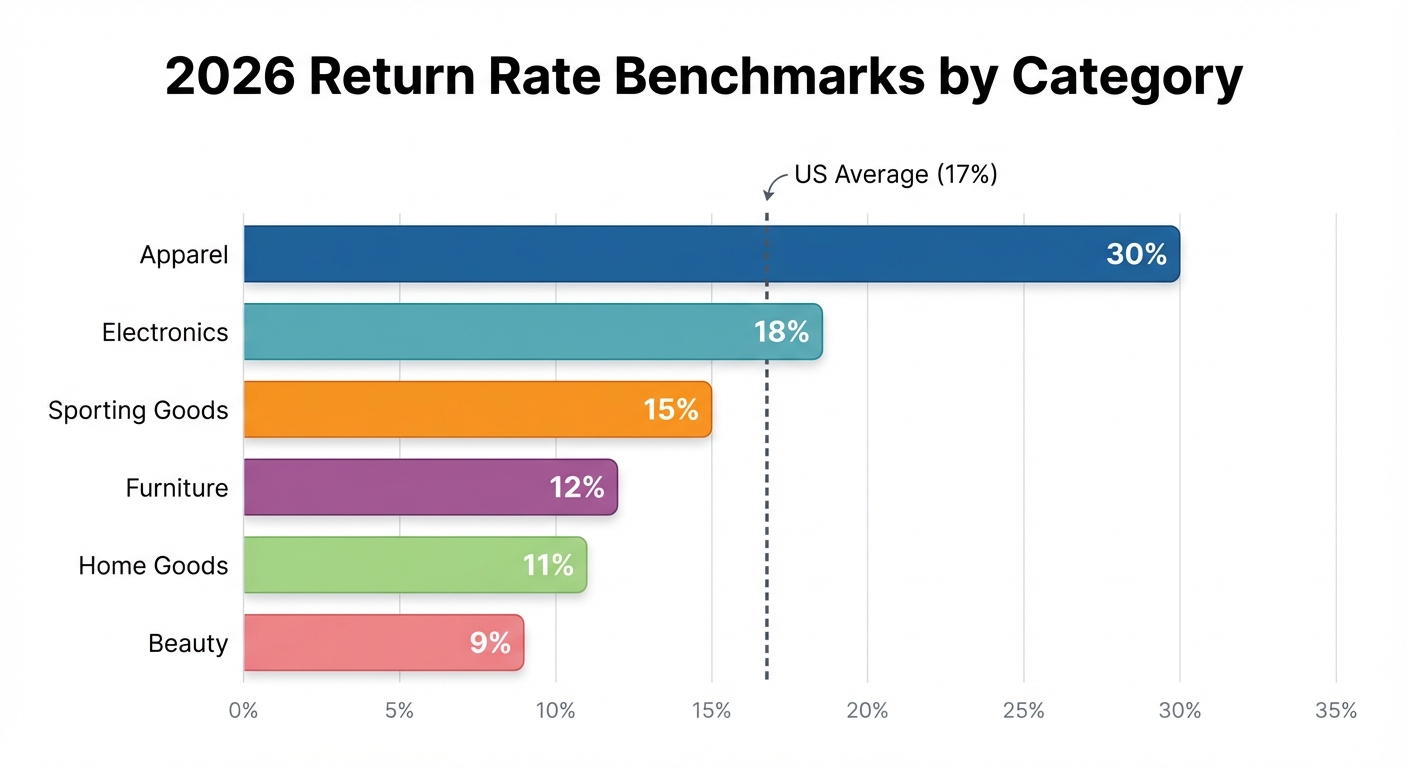
| Category | Typical Return Rate | Range | Primary Reason |
|---|---|---|---|
| Apparel | 20–30% | 18–35% | Fit issues, color expectations, quality gaps |
| Shoes | 25–35% | 22–40% | Fit/comfort, sizing inconsistency |
| Electronics | 15–20% | 12–22% | Unmet expectations, defects, buyer's remorse |
| Jewelry & Accessories | 15–20% | 12–25% | Fit, style disappointment, condition |
| Home & Garden | 10–15% | 8–18% | Dimension/fit issues, damage in shipping |
| Sporting Goods | 10–15% | 8–17% | Performance expectations, durability concerns |
| Beauty & Skincare | 5–10% | 3–12% | Allergic reactions, formula mismatch, breakage |
| Food & Supplements | 3–5% | 1–7% | Damage, expiration, dissatisfaction |
These aren't guesses. They're based on thousands of orders across platforms like Amazon, Shopify, WooCommerce, and direct-to-consumer brands.
Notice a pattern? Soft goods (apparel, shoes) have the highest rates. Consumables (food, beauty) have the lowest.
Why? Because a t-shirt is easy to return. A jar of skincare you've already opened isn't.
Why These Rates Exist: Category-By-Category Breakdown
Apparel (20–30% Return Rate)
Apparel leads the charts in returns—and it's not an accident.
Fit is the enemy. Your customer sees a medium on the website, orders it, and it runs small. Or they like the color online but hate it at home. Or they wanted a "cozy fit" and got "oversized."
The fit problem gets worse with international shipping. When your customer is 5,000 miles away, they're returning based on a gamble, not experience.
Why it matters: A single apparel return involves a full shipped item back. You're eating return shipping, re-processing, and a product that's now worn (technically "worn once" but unsellable at full price). That's depreciation on top of logistics.
Shoes (25–35% Return Rate)
Shoes are actually worse than apparel. Why? Because fit is invisible until your customer puts them on.
A shoe that looks right might pinch. It might slip. It might feel stiff. Your customer has paid good money and their feet are the judge—not a photo.
International sizing compounds this. A size 10 in Europe isn't a size 10 in the US. Your customer is guessing. They're ordering multiple sizes and returning what doesn't fit.
Why it matters: Like apparel, but worse. Shoes are heavy (return shipping costs spike). They take up shelf space when you get them back. And a "worn once" shoe is worth 40–60% of retail, not 100%.
Electronics (15–20% Return Rate)
Electronics returns come from two sources: actual defects and buyer's remorse.
"Defects" might be real (the device doesn't power on). Or it might be perceived (the customer thought the camera would zoom farther than it does). Both end up as returns.
This is the expectation-gap category. Someone watches a YouTuber unbox a phone and thinks it'll change their life. When it's just... a phone... it gets returned.
Why it matters: Electronics returns are logistically expensive (weight, packaging), and they depreciate fast. A returned laptop loses 20–30% of value the moment the box is opened. Restocking and certified refurbishing eat into margin further.
Beauty & Skincare (5–10% Return Rate)
Beauty has the lowest return rates (besides food) because customers have already opened and tested the product.
Once that serum is opened, a return is a hassle. And if the customer got what they expected—a product that works on their skin—they're not thinking about returns.
Why it matters: Low return rate also means lower depreciation. You can't resell an opened jar of moisturizer. So when it does get returned, it's a total loss. But this happens rarely enough that it doesn't wreck margins.
Food & Supplements (3–5% Return Rate)
The lowest return rate. Why? Because most customers won't return food.
Even if a supplement tastes bad or doesn't work as promised, the friction is too high. They might leave a one-star review, but they're not packing it back up and paying return shipping.
Why it matters: Minimal returns mean predictable margins. When a return does happen, it's unsellable (can't resell opened food), but it happens so rarely that it's statistically insignificant to your bottom line.
Home & Garden (10–15% Return Rate)
Moderate returns driven by dimension/fit problems ("It's bigger than I expected") and shipping damage.
A 48-inch bookshelf that arrives with a cracked side is getting returned. A planters set that won't fit on the patio is getting returned.
Why it matters: These items are heavy and bulky. Return shipping costs are high. But they're also less fashion-sensitive, so a returned item might be resellable at 70–80% of retail.
Sporting Goods (10–15% Return Rate)
Customers return sporting goods when performance doesn't meet expectations.
A yoga mat that's too thin. Running shoes that don't feel right. A kettlebell that's not the quality they imagined.
Why it matters: Sporting goods occupy a middle ground. They're returnable, but customers use them first (testing the fit, feel, durability). So returns often come from genuine defects or performance gaps, not just "I changed my mind."
Jewelry & Accessories (15–20% Return Rate)
Fits, styles, and quality expectations drive returns here.
A necklace that's shorter than expected. A belt that doesn't go with anything. A watch that scratches easily.
Why it matters: Jewelry depreciates hard once returned (scratches, tarnish, et cetera). And returns are often driven by style/preference, not defects, so you can't just restuff them as new.
The Hidden Cost of Each Return: A Real Cost Model
Here's where most sellers go wrong. They think returns cost the processing fee + return label. That's not even close.
Let's build a complete cost model. For a single returned order:
1. Lost Processing Fee: $2–3 per order (payment processor fee already spent, not recovering it)
2. Outbound Shipping: $5–15 (cost you paid to ship it the first time)
3. Return Shipping: $3–10 (you're paying for the return label or credit)
4. Handling & Re-processing: $2–5 (labor to inspect, photograph, restock or dispose)
5. Product Depreciation: This is the killer.
- Apparel: 30–50% of COGS lost
- Electronics: 25–40% of COGS lost
- Beauty: 70–100% of COGS lost (usually unsellable)
- Food: 100% of COGS lost (unsellable)
- Jewelry: 40–60% of COGS lost
Let's say you're selling a $50 hoodie with a $15 COGS. A return costs you:
- Processing fee: $2
- Outbound shipping: $8
- Return shipping: $6
- Handling: $3
- Depreciation: $15 × 40% = $6
Total cost per return: $25
That's half the retail price just to handle the return. And you're left with a $15 hoodie you have to discount to 60% to move.
Want to see your real numbers?
Try our free profit calculator — plug in your numbers and see your real net margin in 30 seconds.
Try the free calculator →Two Real-World Examples: The Profit Impact
Let's model the annual impact for two real sellers.
Example 1: Apparel Store (25% Return Rate)
Baseline metrics:
- Monthly revenue: $50,000
- Average order value: $65
- Monthly orders: 769
- Monthly returns: 192 (25%)
- Product COGS: 40% of retail
- Shipping cost (outbound): $7 per order
Monthly return cost:
- Processing fees lost: 192 × $2 = $384
- Outbound shipping (already spent): 192 × $7 = $1,344
- Return shipping: 192 × $5 = $960
- Handling: 192 × $3 = $576
- Depreciation (35% of COGS): 192 × ($65 × 0.40 × 0.35) = $1,747
Total monthly return cost: $5,011
Annual return impact: $60,132
That's 12% of annual revenue, just sitting in returns. No refund given, no inventory recovered, no margin preserved.
What if you cut returns from 25% to 20%?
That's 38 fewer returns per month. At $5,011 ÷ 192 returns = $26.10 per return saved.
38 returns × $26.10 = $992 saved per month, or $11,904 per year.
Example 2: Beauty Store (7% Return Rate)
Baseline metrics:
- Monthly revenue: $40,000
- Average order value: $48
- Monthly orders: 833
- Monthly returns: 58 (7%)
- Product COGS: 35% of retail
- Shipping cost (outbound): $4.50 per order
Monthly return cost:
- Processing fees lost: 58 × $2 = $116
- Outbound shipping (already spent): 58 × $4.50 = $261
- Return shipping: 58 × $3.50 = $203
- Handling: 58 × $2 = $116
- Depreciation (90% of COGS, mostly unsellable): 58 × ($48 × 0.35 × 0.90) = $1,089
Total monthly return cost: $1,785
Annual return impact: $21,420
That's 5.4% of annual revenue. Still meaningful, but half the impact of the apparel store.
If the beauty store cut returns from 7% to 5%:
58 returns × (7% − 5%) / 7% = 16.5 fewer returns per month.
16.5 × ($1,785 ÷ 58) = $507 saved per month, or $6,084 per year.
The lesson: A 2% reduction in returns is worth $11,904/year to the apparel store but only $6,084/year to the beauty store. Why? Higher depreciation and higher shipping costs in apparel make each return disproportionately expensive.
Online vs. In-Store Return Rates: A Comparison
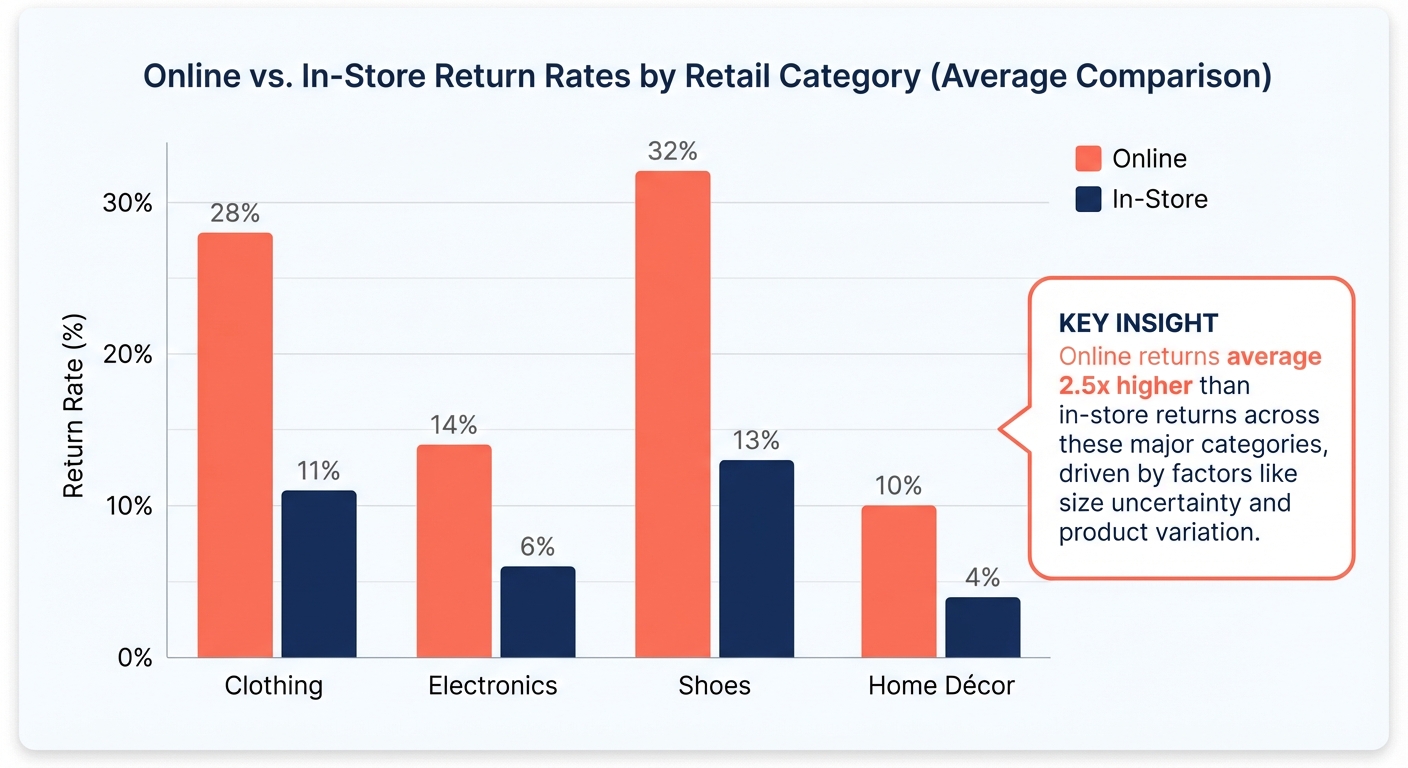
Curious how online stacks up against physical retail?
| Channel | Typical Return Rate | Key Difference |
|---|---|---|
| E-commerce (online) | 15–25% | No try-before-buy; shipping adds friction but also enables easier returns |
| In-store (physical retail) | 5–10% | Customer tries on/tests; immediate satisfaction; higher friction to return (in-person trip required) |
In-store is 2–3x lower. Why? Because your customer already tried it on. The fit is proven. The color matches real lighting. There's less surprise.
Online returns spike because customers are buying blind (especially internationally). They're ordering multiple sizes. They're hoping it'll work, not knowing it'll work.
The takeaway: If you're selling online, you need better fit descriptions, size guides, and product photography. In-store, a customer tried it. Online, they're guessing.
How to Reduce Returns by Category
Apparel & Shoes: Master Fit
- Detailed size guides: Show measurements, not just S/M/L. Include fit feedback from real customers ("This runs small").
- Size comparison photos: Show the same model in different sizes. Let customers see the difference.
- Video try-ons: Partner with micro-influencers in your size range. Show real fit.
- Easy exchanges: Make size swaps friction-free. A customer who exchanges (instead of returning) often keeps both items.
- Fit quiz: Ask body type, height, preferred fit (snug vs. loose). Recommend the right size.
Target: Reduce from 25–30% to 18–22%.
Electronics: Kill Expectation Gaps
- Honest specs: Don't oversell. If the camera is 12MP, say it's 12MP. Show sample photos taken with that device.
- Detailed unboxing: Video the unboxing. Show exactly what's in the box. No surprises.
- Real-world reviews: Encourage customers to post videos using the product (not just photos).
- 30-day trial period: Let customers test it. You'll reduce returns from people who "changed their mind" but keep genuine defects.
Target: Reduce from 15–20% to 10–15%.
Beauty & Skincare: Reduce Friction
- Sample sizes: Let customers try before buying full size. A $3 sample now = a $30 sale later with no return.
- Ingredient transparency: List allergens, ingredient sourcing, skin type recommendations.
- Clear return policy for opened items: "We'll take opened products back if you've only used it once." Reduces anxiety. Paradoxically, fewer people return when they know they can.
Target: Stay at 5–10% (already low, but sample programs can push it to 3–5%).
Home & Garden: Prevent Logistics Issues
- Detailed dimensions: Show real photos with items next to common objects (coin, hand, typical bookshelf) for scale.
- Packaging specs: Show packed dimensions and weight. Let customers confirm it'll fit through their doorway.
- Damage prevention: Invest in quality packaging. A broken item gets returned; a perfectly-packed item doesn't.
- Installation guides: Pre-emptively answer setup questions. A customer who gets it set up smoothly isn't returning.
Target: Reduce from 10–15% to 7–12%.
The Bottom Line: Your Return Rate is Your Hidden Profit Leak
Here's the uncomfortable truth: you might be optimizing for the wrong metric.
Everyone talks about return rate percentage. "We're at 20%." "We want to get to 15%."
But what matters is the absolute dollar cost of those returns. And that cost is hidden. It lives in:
- Packaging you paid for
- Shipping you paid for
- Labor you're paying for
- Inventory you can't resell
- Margin you're losing
A 15% return rate in apparel might be costing you $15,000 per month. A 15% return rate in jewelry might be costing you $8,000 per month. Same percentage, different impact.
Here's what to do:
- Know your numbers. Calculate the true cost per return for your categories, not the industry average.
- Prioritize by impact. A 2% reduction in high-cost categories (apparel, electronics) is worth more than a 5% reduction in low-cost categories (beauty, food).
- Invest accordingly. Spend $500 on better product photography if it reduces apparel returns from 25% to 22%. That's $11,000+ in annual savings.
- Track by category. Don't lump all returns together. An apparel return isn't the same as a beauty return.
FAQ
Q: Is a 20% return rate normal?
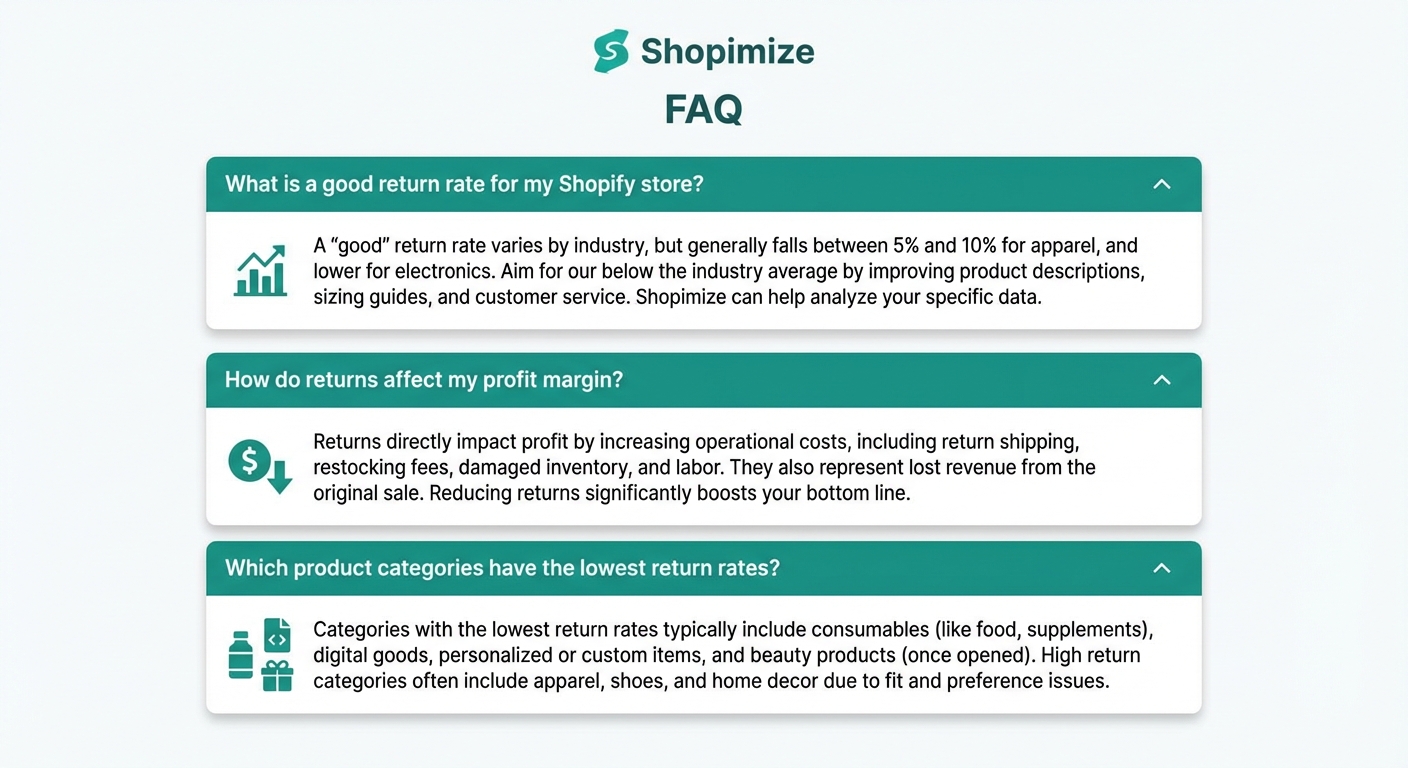
A: It depends on category. In apparel and shoes, 20% is low. In beauty, 20% would be alarming. Know your category benchmark.
Q: Should I charge a restocking fee?
A: Short answer: no. Customers already expect free returns. A restocking fee creates friction and hurts repeat purchase rates. Better to invest in preventing the return in the first place.
Q: What if my return rate is higher than the benchmark?
A: You have a problem worth solving. Start with product photography and descriptions. Then look at fit/sizing. Then expand to logistics (is packaging damaging products?). Each category has a different lever.
Q: Can I resell returned items?
A: Yes, but at a discount. Plan for 40–60% of retail value, depending on category. For consumables (beauty, food), most can't be resold at all.
Q: How do returns affect my shipping costs?
A: Significantly. Outbound shipping is a sunk cost (you already paid it). Return shipping is a new cost. And heavier items (electronics, shoes, home goods) make return shipping expensive. A return is like paying for shipping twice.
Ready to Track the Real Cost of Returns?
You now know what your returns actually cost you. But most sellers are flying blind—they see the return rate percentage and move on.
Want to see exactly how returns impact your bottom line—by product, by month? Want to know which category is your biggest profit leak?
Try Shopimize free and track the real cost of every return. See which products are dragging down margin. See where returns are spiking. See the actual dollars walking out the door.
Your return rate is hidden profit waiting to be reclaimed.