
Are Your Facebook Ads Actually Making You Money on Shopify?
You're running Facebook ads. Sales are coming in. Your ROAS looks decent — maybe 3x, maybe 4x. Your ad dashboard says you're winning.
But at the end of the month, you check your bank account and wonder where the money went.
This is one of the most common problems Shopify merchants face: their Facebook ads feel profitable, but their actual facebook ads shopify profit is impossible to verify because they're looking at the wrong numbers. ROAS, reach, click-through rates — these metrics tell you about ad performance. They don't tell you whether you made money.
This article is about fixing that. We'll walk through exactly how to calculate whether your Facebook ads are profitable after every real cost is accounted for — and why most merchants are flying blind without realizing it.
What Does "Facebook Ads Profit" Actually Mean?
Before we get into calculations, let's define the term properly.
Profit from Facebook ads is the revenue generated by your ad campaigns minus every cost associated with fulfilling and selling those orders — including the ad spend itself. That means cost of goods sold (COGS), Shopify transaction fees, payment processing fees, shipping costs, and the ad spend that drove the sale in the first place.
It is not revenue minus ad spend. That's not profit — that's a partial picture, and it will lead you to bad decisions.
Why ROAS Is Misleading You
Let's start with the metric every Facebook advertiser talks about: return on ad spend, or ROAS.
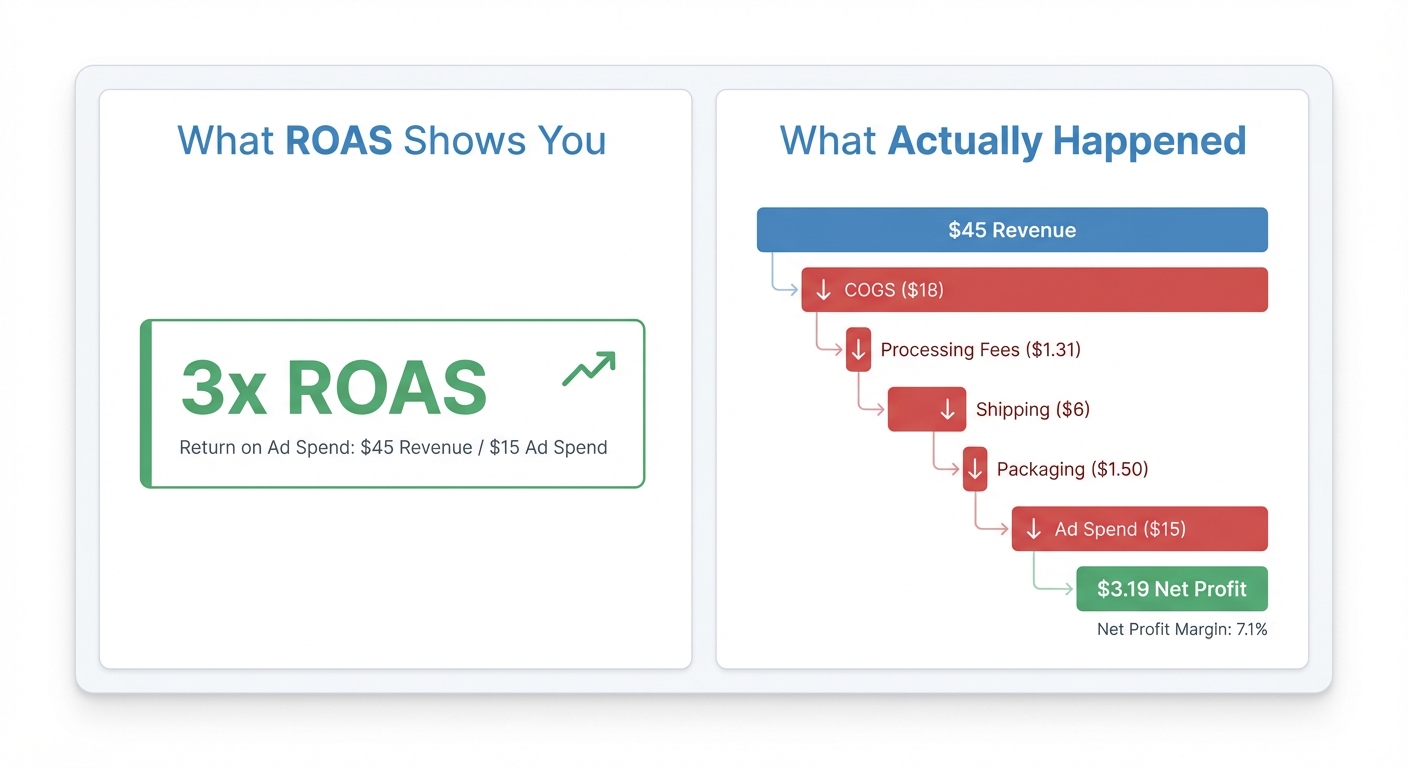
A 3x ROAS means that for every $1 you spend on ads, you generate $3 in revenue. On the surface, that sounds like a win. And in some businesses, it is. But here's the problem — ROAS has no idea what your margins are.
Say you're running a store selling a product for $45. You spent $15 in ads to generate that sale. Your ROAS is 3x. Great.
But now let's look at the full picture:
- Revenue: $45
- COGS (product cost): $18
- Shopify Payments processing fee: ~$1.31 (2.9% + $0.30)
- Shipping to customer: $6
- Packaging: $1.50
- Facebook ad spend: $15
Total costs: $41.81
Actual profit: $3.19
That's a 7% net margin on a sale your ad dashboard called a winner. One return or one customer service email, and you've wiped out the profit entirely.
This isn't a made-up edge case. We've seen this pattern across dozens of Shopify stores — merchants confidently scaling campaigns that are barely breaking even, or actively losing money.
The Real Costs Facebook Ignores
Facebook's ad reporting is built to make Facebook look good. That's not a conspiracy — it's just business. Their job is to show you that their platform is driving value. Your job is to figure out whether that value survives contact with reality.
Here are the costs that Facebook's dashboard will never account for:
Cost of goods sold (COGS)
This is what you paid to source or manufacture the product you just sold. For dropshippers, it's the supplier price. For brands with inventory, it's the landed cost per unit including any import duties or freight. Facebook doesn't know this number. You have to bring it yourself.
Shopify and payment processing fees
If you're on Shopify Payments, you're paying 2.9% + $0.30 per transaction on the Basic plan (lower on higher plans). If you use a third-party payment processor, add another 0.5-2% on top depending on your Shopify plan. Shopify's fee structure is documented on their pricing page — it's worth knowing your exact rate.
On a $45 order, Shopify Payments on the Basic plan takes $1.61. Small per transaction, but across hundreds of orders it compounds quickly.
Shipping costs
Free shipping offers are fantastic for conversion rates. They're less fantastic for your margins if you haven't priced them in. A flat-rate $6 USPS ground shipment per order is easy to forget when you're looking at top-line revenue.
Returns and refunds
Facebook counts the revenue from that sale. You're going to eat the product cost, the return shipping, and potentially the original shipping on any returned order. If your category has a 10-15% return rate (common in apparel), your effective revenue from Facebook ads is meaningfully lower than the dashboard shows.
Chargebacks
Rare, but real. Each chargeback costs you the product, the shipping, and a $15 dispute fee on top.
Track this automatically
Shopimize shows your real profit per order, per product, per channel.
Try Shopimize free →How to Calculate Your True Facebook Ads Profit
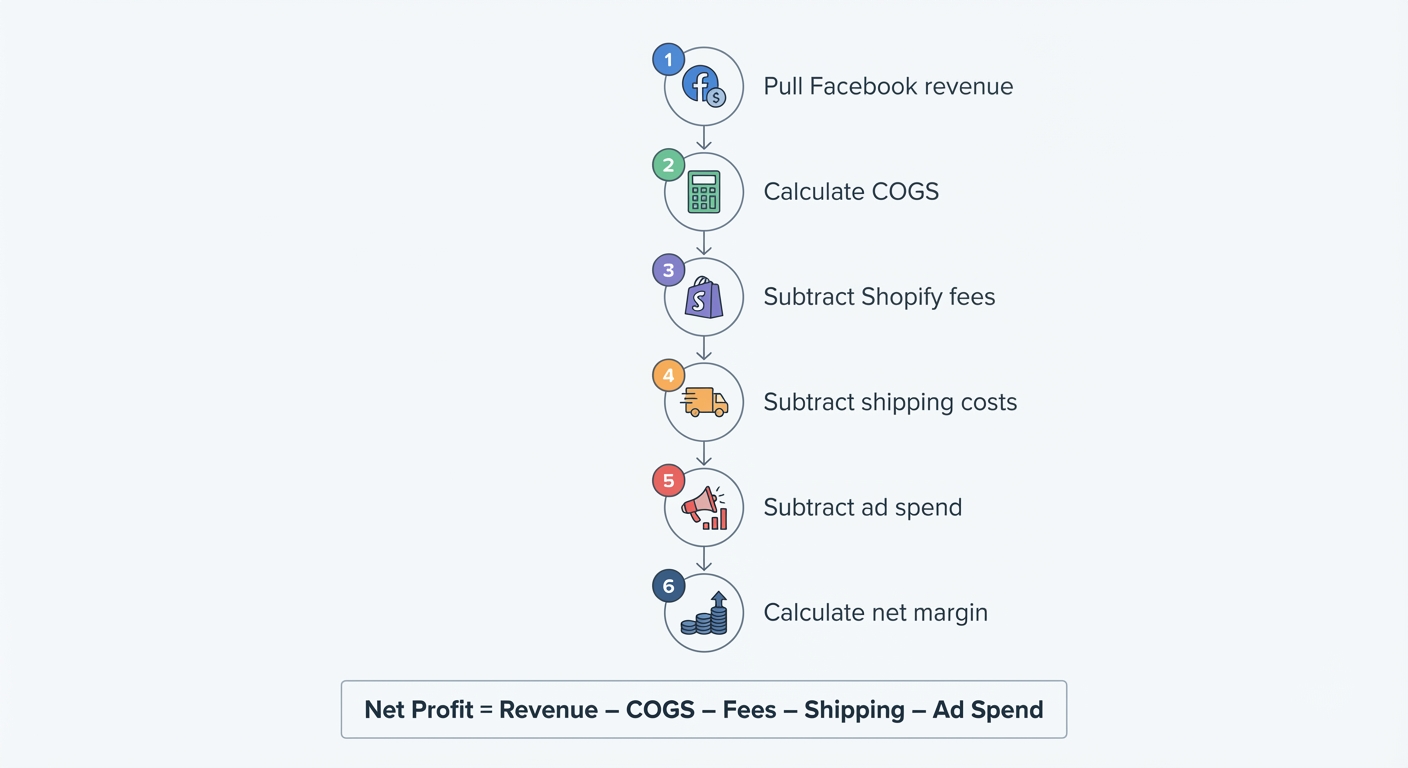
Here's a framework you can use right now. It's not complicated — it just requires pulling numbers from more than one place.
Step 1: Pull your revenue from Facebook campaigns
Go to Ads Manager, set your attribution window, and note the total purchase value attributed to each campaign. Be honest with yourself about your attribution model — 7-day click is standard, but it may overcount if customers were going to buy anyway.
Step 2: Calculate your blended COGS for those orders
Multiply your average COGS per unit by the number of orders attributed to the campaign. If you have different products with different costs, you'll need to weight this by product mix. This is the step most merchants skip, and it's the most important one.
Step 3: Subtract all Shopify fees
Take your total revenue from those orders and apply your Shopify Payments rate (or whatever processor you use). Add in any Shopify transaction fees if you're not on Shopify Payments. Don't forget the $0.30 per-transaction flat fee — it adds up on high-volume, lower-value orders.
Step 4: Subtract shipping and fulfillment costs
Pull your actual shipping costs for those orders from your carrier account or Shopify's shipping reports. If you're using a 3PL, include their pick-and-pack fee per order.
Step 5: Subtract ad spend
This one you already have from Ads Manager. This is the cost of acquiring the customer. Everything above is the cost of serving them.
Step 6: Calculate net profit and net margin
Net profit = Revenue − COGS − Shopify fees − Shipping − Ad spend − Any other variable costs
Net margin = (Net profit ÷ Revenue) × 100
If that number is positive and above 10%, you're in good shape. Between 0-10%, you're in a zone where small changes — a shipping rate increase, a supplier cost bump, a higher return rate — can flip you negative. Below 0%, you're funding your customers' shopping habits.
You can plug in your own numbers with our free profit calculator to see where your campaigns actually stand.
A Tale of Two Campaigns
Let's make this concrete with two campaigns running simultaneously.
Campaign A — Winning Product:
- Revenue: $8,400 (140 orders at $60 avg.)
- Ad spend: $1,200
- ROAS: 7x
- COGS: $2,100 ($15 per unit)
- Shopify fees: ~$285
- Shipping: $840 ($6 per order)
- Net profit: $3,975 | Net margin: 47%
Campaign B — "Good ROAS" Product:
- Revenue: $6,000 (100 orders at $60 avg.)
- Ad spend: $2,000
- ROAS: 3x
- COGS: $2,800 ($28 per unit, higher-end product)
- Shopify fees: ~$204
- Shipping: $900 ($9 per order, heavier item)
- Net profit: $96 | Net margin: 1.6%
Campaign B has a 3x ROAS, which most merchants would consider acceptable. But it's nearly breakeven. Campaign A at 7x ROAS is actually generating almost $4,000 in real profit.
The insight here isn't just "high ROAS good." It's that ROAS doesn't account for COGS or shipping, so two campaigns with the same revenue and different product mixes will look the same in Ads Manager but be completely different businesses financially.
The Attribution Problem Nobody Talks About
There's another layer to this that's worth addressing directly: Facebook's attribution is imperfect, and post-iOS 14, it got worse.
Facebook might claim credit for a sale that was already going to happen — a customer who saw your ad but had already been searching for your product on Google. It might double-count with Google Ads if you're running both. It might miss sales that happened outside the attribution window.
This means your Facebook-attributed revenue in Ads Manager is likely an overcount, and your true incremental revenue from Facebook is lower.
The honest approach is to use a blended efficiency metric alongside ROAS. Take your total revenue for the period, subtract all your ad spend across all channels, and see what your overall profitability looks like. If your blended margin is healthy, your ads are probably working. If you have a great ROAS but thin blended margins, something is off.
What a Profitable Facebook Ads Setup Actually Looks Like
A few benchmarks worth knowing. These vary by category, but they're a reasonable starting point.
Most Shopify merchants running Facebook ads profitably are operating at a net margin of 15-30% after all costs. Below 15% leaves very little room for error. Above 30% is excellent — either you have strong product margins, low shipping costs, or very efficient ad spend. Often all three.
On the ad efficiency side, your minimum profitable ROAS depends entirely on your margins. Here's a quick formula:
Minimum profitable ROAS = 1 ÷ (1 − (COGS% + fees% + shipping%))
If your COGS is 40% of revenue, fees are 4%, and shipping is 10%, your non-ad costs are 54% of revenue. You need to have at least 46% of revenue left over to cover ad spend and profit. That means you need a ROAS of at least 2.17x just to break even — and higher to be profitable.
Most merchants don't know their breakeven ROAS. That's why they're guessing.
Why You Can't Do This Manually at Scale
If you're running two or three campaigns, you can probably do this analysis in a spreadsheet every week. But if you're running 10+ campaigns across multiple ad sets, with different products, different shipping rates, and a mix of new customers and returning buyers — manual reconciliation becomes a part-time job.
And the problem compounds when you scale. More campaigns means more data to reconcile. The merchants who struggle most with profitability at $100k+/month revenue aren't bad marketers — they're operating without a unified view of their numbers.
Seeing Your Real Facebook Ads Shopify Profit
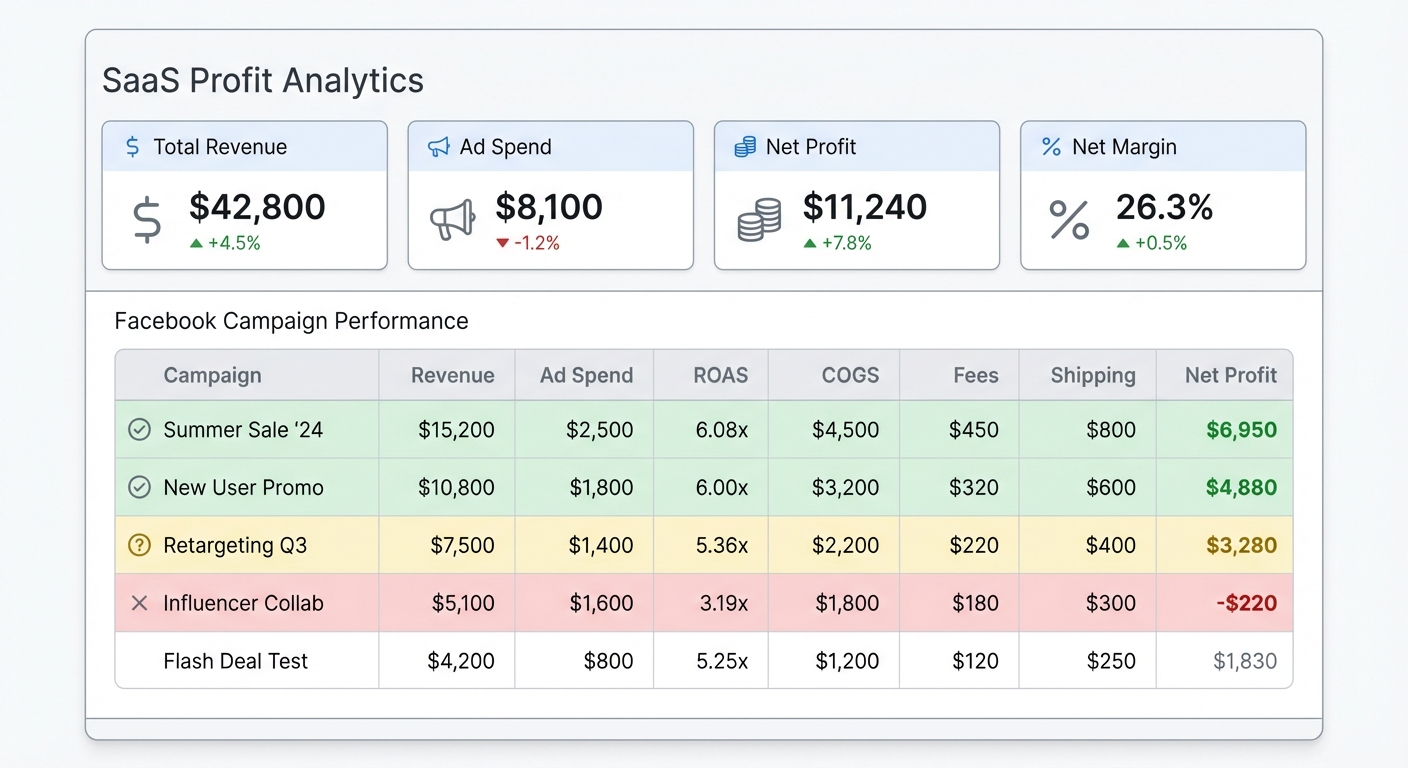
Knowing whether your Facebook ads are generating real facebook ads shopify profit requires pulling data from multiple sources: Facebook Ads Manager, your Shopify backend, your COGS records, and your carrier costs. No single one of these tools gives you the complete picture.
Shopimize was built specifically for this problem. It connects your Shopify store, your COGS, your ad spend from Facebook and other channels, and your actual fulfillment costs into a single view — so you can see net profit per campaign, per product, and per day, without building and maintaining a spreadsheet system.
The stores that grow profitably aren't necessarily the ones with the highest ROAS. They're the ones that know their real numbers and make decisions based on them.
Frequently Asked Questions
What is a good ROAS for Facebook ads on Shopify?
There's no universal answer — it depends on your margins. A 3x ROAS might be profitable for a store with a 70% gross margin and low shipping costs, but unprofitable for a store with a 40% gross margin and expensive fulfillment. Calculate your breakeven ROAS first (1 ÷ gross margin percentage), then aim meaningfully above it.
How do I know if my Facebook ads are profitable after all costs?
Take the revenue Facebook attributes to your campaigns, then subtract COGS, Shopify fees, shipping costs, and ad spend. The result is your actual profit from those campaigns. If you want a quicker way to run the numbers, our free profit calculator can help you work through it.
Why does my ROAS look good but my profit feels low?
ROAS only compares ad spend to revenue — it ignores every other cost in your business. High product costs, shipping, platform fees, and returns all reduce your actual profit without affecting ROAS. A 4x ROAS with a high-COGS product can be less profitable than a 2.5x ROAS with a high-margin product.
How does iOS 14 affect Facebook ads profitability tracking?
Apple's AppTrackingTransparency framework, introduced with iOS 14, limited Facebook's ability to track conversions across apps and websites. This means Facebook's reported conversions and attributed revenue are less accurate than they were before 2021 — typically an undercount of some conversions, but sometimes an overcount due to modeled data. The safest approach is to cross-reference Facebook's numbers with your actual Shopify order data and look at blended profitability across all channels.