
Are Your Facebook Ads Actually Profitable? Here's How to Check
You're staring at your Meta Ads Manager. The dashboard screams success: a 4.2x ROAS, thousands in attributed revenue, growing sales month-over-month. Your boss is happy. Your team celebrates. But then you look at your actual bank account, and something doesn't add up.
You're not going crazy. Your Facebook ads might look profitable in the dashboard and still be losing you money in reality.
This happens more often than you'd think, especially for Shopify sellers. The problem isn't that Meta is lying to you—it's that Meta's dashboard tells an incomplete story. It shows you revenue, not profit. And in e-commerce, those are very different things.
Let me show you exactly what's hidden in that gap, and how to calculate your real Facebook ads profit.
Why Meta's Dashboard Is Misleading (And It's Not Meta's Fault)
Meta Ads Manager is built to show attributed revenue. That's the money that came in because someone clicked your ad. It's useful, sure. But here's what it's missing:
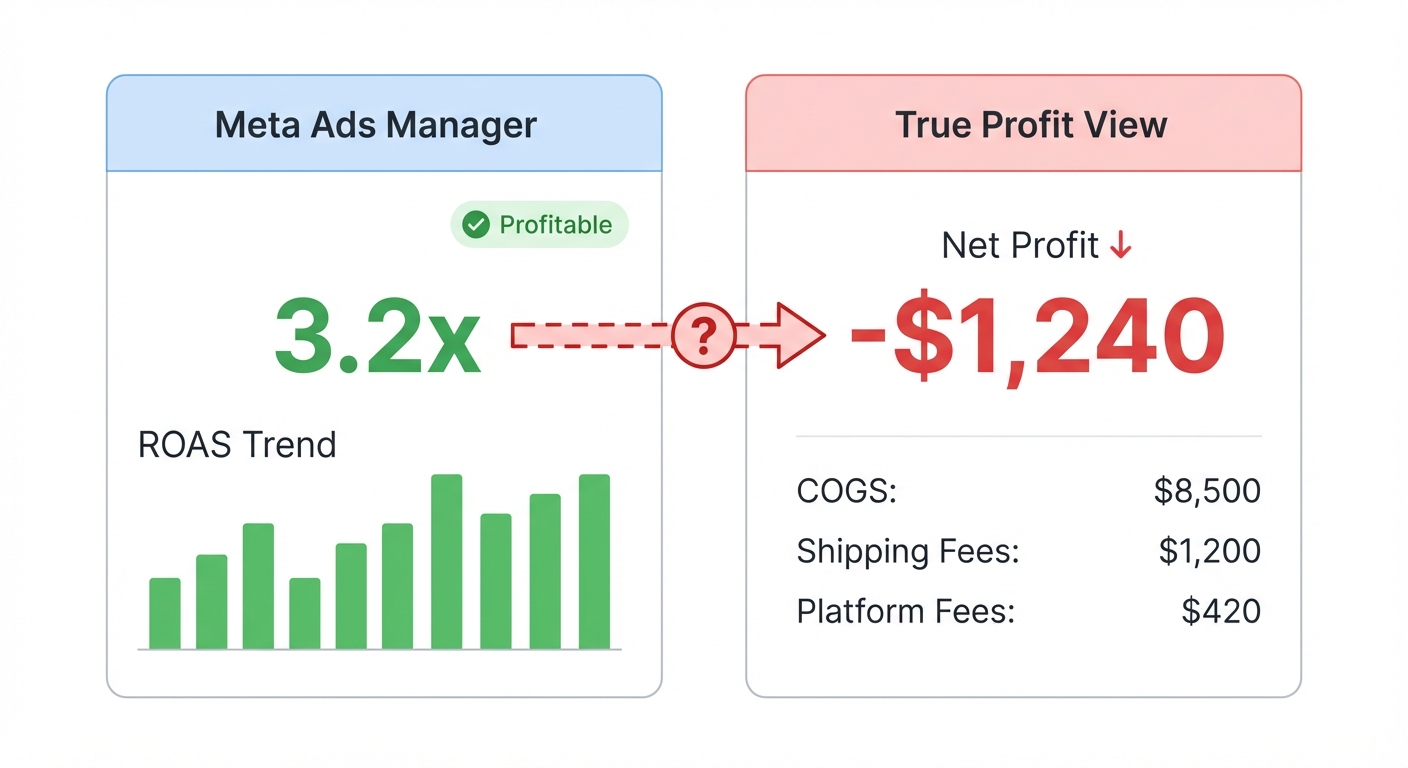
- Cost of goods sold (COGS). That product you "sold" for $65? It cost you $28 to make or buy. Meta doesn't know that.
- Shipping costs. You paid $5.50 to ship it. Not accounted for.
- Payment processing fees. Shopify, Stripe, whatever you use—it takes a cut. Usually 2.9% + $0.30. Meta ignores this.
- Returns and refunds. Some percentage of those "conversions" come back. The dashboard counts them as wins anyway.
- Attribution modeling issues. Especially since iOS 14, Meta's conversion modeling inflates reported metrics by 15-30% in many cases.
When you add all this up, a campaign that looks like it's making money is often just covering costs—or running at a loss.
[IMAGE PLACEHOLDER: screenshot of Meta Ads Manager dashboard showing 4.2x ROAS with a red X over it, and then a spreadsheet showing actual profit calculation]
The Facebook Ads Profit Formula
Here's what you actually need to know:
Profit per ad-driven order = (AOV − COGS − Shipping − Processing fees) − CPA
Let me break this down:
- AOV = Average Order Value (the revenue per order attributed to your ad)
- COGS = Cost of Goods Sold (what it costs you to make/buy the product)
- Shipping = What you paid to ship it to the customer
- Processing fees = Payment processor cut (typically 2.9% + $0.30 for Shopify)
- CPA = Cost Per Acquisition (total ad spend ÷ number of conversions)
If that number is negative, you're losing money. If it's small (under $5), you're probably not actually winning once you factor in overhead, support, and the orders that come back.
Real Example: The Supplement Brand That Looked Profitable
Let's walk through a real scenario. You're selling a supplement stack. Here's what your Meta dashboard shows:
| Metric | Value |
|---|---|
| Ad Spend | $2,500 |
| Attributed Revenue | $10,500 |
| Conversions | 150 orders |
| ROAS | 4.2x |
Looks fantastic, right? You made $10,500 on a $2,500 spend. That's a clean $8,000 profit. Time to scale.
Not so fast. Let's look at the reality:
| Component | Amount |
|---|---|
| Average Order Value (AOV) | $70 |
| Cost per order (CPA) | $16.67 |
| Product COGS | $22 |
| Shipping cost | $5.50 |
| Payment processing (2.9% + $0.30) | $2.33 |
| Profit per order | $23.50 |
| Total profit from campaign | $3,525 |
That's still good, but it's less than half of what the dashboard suggested. Now let's add one more layer of reality:
Your return rate is 8% (industry average for supplements). So 12 of those 150 orders come back. Your actual profit is really:
$3,525 − (12 × $23.50) = $3,525 − $282 = $3,243
You've gone from a supposed $8,000 win to a $3,243 win. Still profitable—but you'd been planning your scaling budget on a phantom $5,000.
[IMAGE PLACEHOLDER: side-by-side comparison showing Meta dashboard ("4.2x ROAS, $8,000 profit") vs actual profit calculation ("$3,243 actual profit")]
Track this automatically
Shopimize shows your real profit per order, per product, per channel.
Try Shopimize free →The Hidden Problem: Three Campaigns, Same ROAS, Different Profits
Here's where it gets even trickier. Imagine you're running three Facebook campaigns for different product lines. All three show exactly 3.0x ROAS. By Meta's logic, they're equally good. By reality? One is crushing it, one is barely breaking even, and one is losing money.
Campaign A: Premium skincare
- AOV: $85
- COGS: $18
- Shipping: $6
- Processing: $2.77
- CPA: $20
- Profit per order: $38.23
Campaign B: Budget-friendly skincare
- AOV: $35
- COGS: $14
- Shipping: $6
- Processing: $1.31
- CPA: $8
- Profit per order: $5.69
Campaign C: Skincare bundles (loss leader)
- AOV: $50
- COGS: $24
- Shipping: $7
- Processing: $1.75
- CPA: $15
- Profit per order: $2.25
All three show the same ROAS. But Campaign A funds your business. Campaign B covers itself. Campaign C is a slow bleed. If you're scaling based on ROAS alone, you might kill Campaign A and double down on Campaign C, which sounds smarter but actually tanks your profitability.
This is why ROAS is a trap. It's a vanity metric. Profit per order is what matters.
The Attribution Gap: Why Meta Overstates Your ROAS
Since Apple's iOS 14 privacy update in 2021, Meta shifted to "conversion modeling." Instead of tracking every click and conversion directly, they estimate conversions based on aggregated data and machine learning.
This modeling is usually directionally accurate. But it inflates numbers. Studies and real-world data suggest Meta's reported conversions run 15-30% higher than actual pixel-trackable conversions in many cases.
Why does this matter? Because your CPA calculation might be off.
If Meta says you got 150 conversions but you actually got 120 trackable ones, your real CPA is higher:
- What Meta says: $2,500 ad spend ÷ 150 conversions = $16.67 CPA
- What's actually happening: $2,500 ad spend ÷ 120 conversions = $20.83 CPA
That extra $4.16 per order is the difference between healthy profit and break-even.
The fix? Cross-reference Meta's numbers with your Shopify reports, Google Analytics, and actual tracked pixels. If there's a gap, adjust your profitability calculations down. Your real profit is lower than the formula suggests.
[IMAGE PLACEHOLDER: graph showing "Meta reported conversions" vs "actual tracked conversions" with a 20% gap highlighted]
Build Your Own Facebook Ads Profit Calculator
You don't need fancy software (though Shopimize makes this way easier). You can do this in a spreadsheet right now. Here are the exact steps:
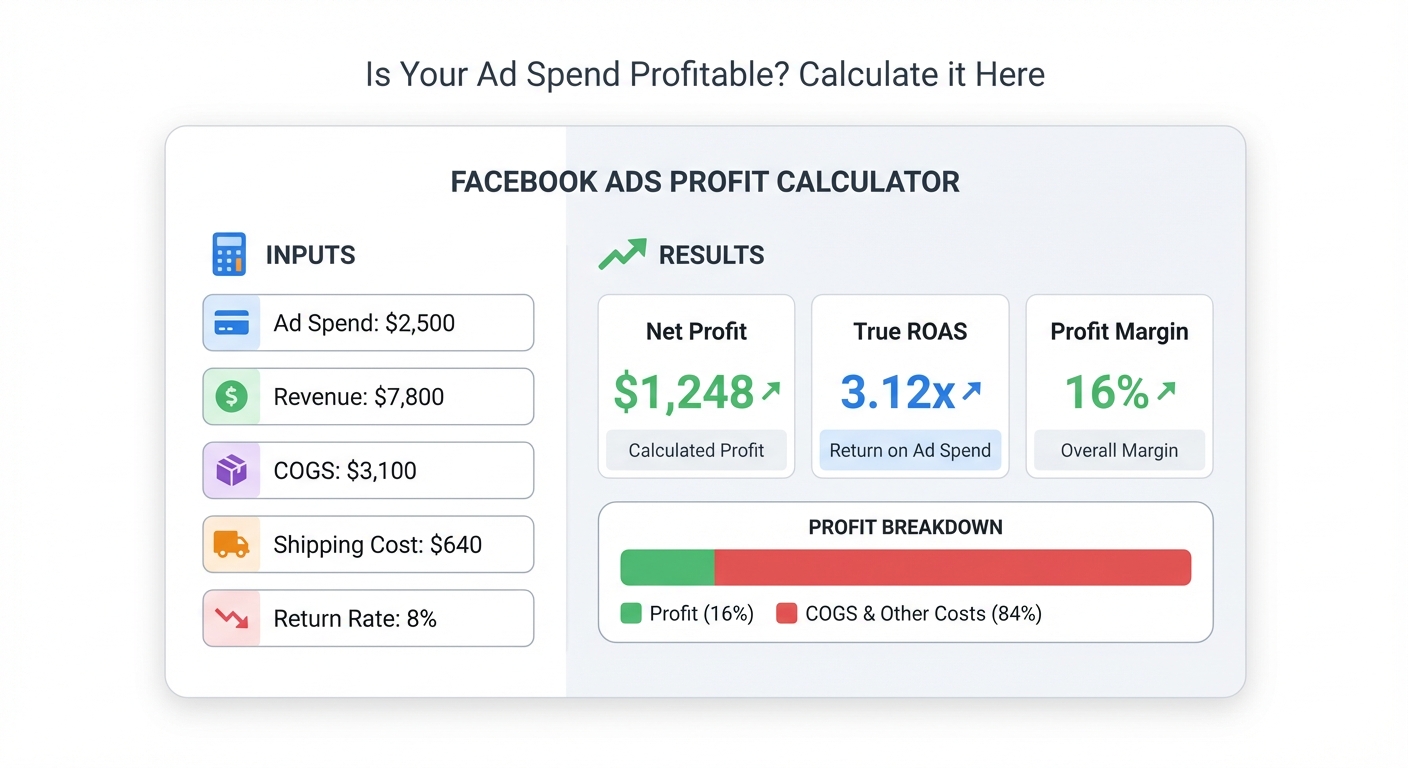
Step 1: Gather your Facebook campaign data
- Total ad spend for the campaign (or month)
- Number of attributed conversions from Meta Ads Manager
- Total attributed revenue
Step 2: Calculate CPA
CPA = Total ad spend ÷ Number of conversions
Example: $2,500 ÷ 150 = $16.67 CPA
Step 3: Find your per-order costs
For each product in the campaign:
- COGS: What you paid the supplier, or cost to produce
- Shipping: Average shipping cost per order (check your Shopify reports)
- Processing fees: For Shopify Payments, it's 2.9% + $0.30. For other processors, find your rate.
- Product mix: If you sell multiple products, calculate a weighted average
Example:
- Weighted AOV: $70
- Average COGS: $22
- Average shipping: $5.50
- Processing (2.9% of $70 + $0.30): $2.33
- Total cost per order: $30.83
Step 4: Calculate profit per order
Profit per order = AOV − Total cost per order − CPA
Example: $70 − $30.83 − $16.67 = $22.50 profit per order
Step 5: Multiply by actual conversions
Total profit = Profit per order × Number of conversions
Example: $22.50 × 150 = $3,375
Step 6: Adjust for returns
Returns kill profitability. If your return rate is 8%:
Adjusted profit = Total profit − (Number of conversions × Return rate × Profit per order)
Example: $3,375 − (150 × 0.08 × $22.50) = $3,375 − $270 = $3,105
That's your real profit. Compare it to what Meta says, and you'll understand the gap.
Campaign-Level Analysis: Not All Conversions Are Equal
This is critical: your account might be profitable overall, but some campaigns are dead weight.
Run this calculation for each campaign separately, not just your account total. You might find:
- Your brand awareness campaign has a 1.5x ROAS but converts at a $50 CPA. Probably a loss.
- Your retargeting campaign has a 6.0x ROAS and a $5 CPA. A money printer.
- Your lookalike audience sits in the middle, looking okay but not great.
Kill or pause the dead weight. Double down on the money printers. Optimize the middle.
Most sellers ignore this because they fixate on account-level metrics. But profit lives at the campaign level.
[IMAGE PLACEHOLDER: table showing 5-6 campaigns with their ROAS, CPA, and actual profit per order, with the money-making ones highlighted in green and unprofitable ones in red]
Actionable Next Steps: What To Do With This Data
Once you've calculated your real profit, here's how to actually improve it:
1. Set hard CPA limits
Don't just chase ROAS. Set a maximum CPA you can afford to pay.
If your profit per order (before ad costs) is $35, your maximum sustainable CPA is probably $20-25. Don't let Meta spend more than that. Set campaign-level budget caps and pause underperforming placements.
2. Test creative to reduce CPA
Your CPA is determined by how cheaply you can acquire customers. Better creative = lower CPA.
Test new ad angles, hooks, testimonials, and product shots. A 20% drop in CPA is a huge profit multiplier. If your CPA drops from $16.67 to $13.33, that's an extra $3.34 profit per order on the same revenue.
3. Cut campaigns below your margin
If a campaign's profit per order is below $10 (or your personal threshold), pause it. No amount of "strong ROAS" saves an unprofitable campaign.
4. Improve product margins
The easier lever is often your cost structure, not your ads.
- Can you negotiate COGS down 10%? That's straight to the bottom line.
- Can you negotiate shipping rates? Same thing.
- Can you raise prices 5% and hold volume? Often yes.
A $5 improvement in margins is worth $5 in ad cost reduction. And margins scale forever; ad efficiency peaks.
5. Optimize for your best customers
Not all conversions are equal. Some customers have higher AOV, lower return rates, higher LTV.
Segment your conversions by customer type (new vs returning, AOV band, geography). Run separate analyses. You might find that your high-AOV customers are way more profitable, even at a higher CPA. Scale toward them.
The Attribution Gap Reality Check
Before you go all-in on these calculations, remember: Meta's numbers might be overstated by 15-30% due to modeling.
Here's a simple reality check:
- Pull your attributed revenue from Meta Ads Manager for the last 30 days.
- Cross-reference with your Shopify analytics for the same period.
- If Shopify shows 15-25% less revenue, that's the gap. Adjust your profit calculations down by that percentage.
This isn't Meta being dishonest—it's just how conversion modeling works. But you need to know it's happening so you don't overspend based on inflated metrics.
[IMAGE PLACEHOLDER: diagram showing "Meta reported revenue" vs "Shopify actual revenue" with an arrow showing the 15-25% gap]
FAQ
What if I have returns and refunds after the fact?
Account for them in your calculations. If your 30-day return rate is 8%, multiply your profit per order by 0.92. It's brutal but necessary.
Should I ignore ROAS entirely?
No. ROAS is a good directional metric. A 2.0x ROAS is a warning sign. A 5.0x ROAS is usually a green light. But use it as a starting point, not an ending point. Always drill down to profit per order.
How do I know my true COGS?
Pull your supplier invoices. For manufactured products, include all raw materials and labor. Don't include overhead (rent, salaries, etc.)—just direct product cost.
What if I'm only testing Facebook ads and don't have a full COGS breakdown?
Estimate conservatively. Use 40-50% of AOV as a rough COGS if you don't know. This will understate your profit, but at least you won't overspend.
Is there an easier way to track all this?
Yes. Tools like Shopimize pull your data directly from Meta and Shopify, calculate real profit per campaign, and show you exactly which ads are making money. But the formula above works in a spreadsheet if that's what you have.
What profit per order should I target?
This depends on your business model, but a healthy e-commerce brand aims for $15-40 profit per order from paid ads. Below $10 and you're running thin. Below $5 and you're gambling.
My ROAS is great but my profit is low. What's wrong?
Usually one of three things: (1) Your product costs are higher than you think, (2) Your CPA is too high, or (3) Meta's attribution is overstating your actual conversions. Run the numbers campaign by campaign to find the culprit.
The Bottom Line
Your Meta Ads Manager is telling you a story. It's a partial story, focused on the metrics Meta cares about. But profit is about the whole picture: revenue minus all costs, minus ad spend.
The good news? You don't need to be a financial analyst to figure this out. A simple spreadsheet and the formula above will show you the truth. And once you know which campaigns are actually making money, you can stop throwing away money on the ones that look good but bleed profit.
The brands that win aren't the ones with the highest ROAS. They're the ones that obsess over profit per order and relentlessly cut unprofitable campaigns.
Start there. The math will set you free.
Want to see your real Facebook Ads profit — per campaign, per product, per day? Try Shopimize free and connect your Meta account in under two minutes.