
How to Track Ad Spend Alongside Profit in One Place
You're running ads. You know how much you're spending—it's right there in Meta Ads Manager. You know your monthly revenue—Shopify tells you that every day. But do you know if those ads are actually profitable?
Most Shopify merchants can't answer that question without digging through at least three different apps or spreadsheets. And by the time they've done the math, the data's already a week old.
This gap between ad spend and profit is costing you money. It's keeping you from scaling what works and cutting what doesn't. And it's easier to fix than you think.
Let's talk about why this happens, how to fix it manually if you need to, and why automated tracking is the only long-term answer.
The Problem: Your Ad Spend and Profit Live in Different Worlds
Here's the typical setup:
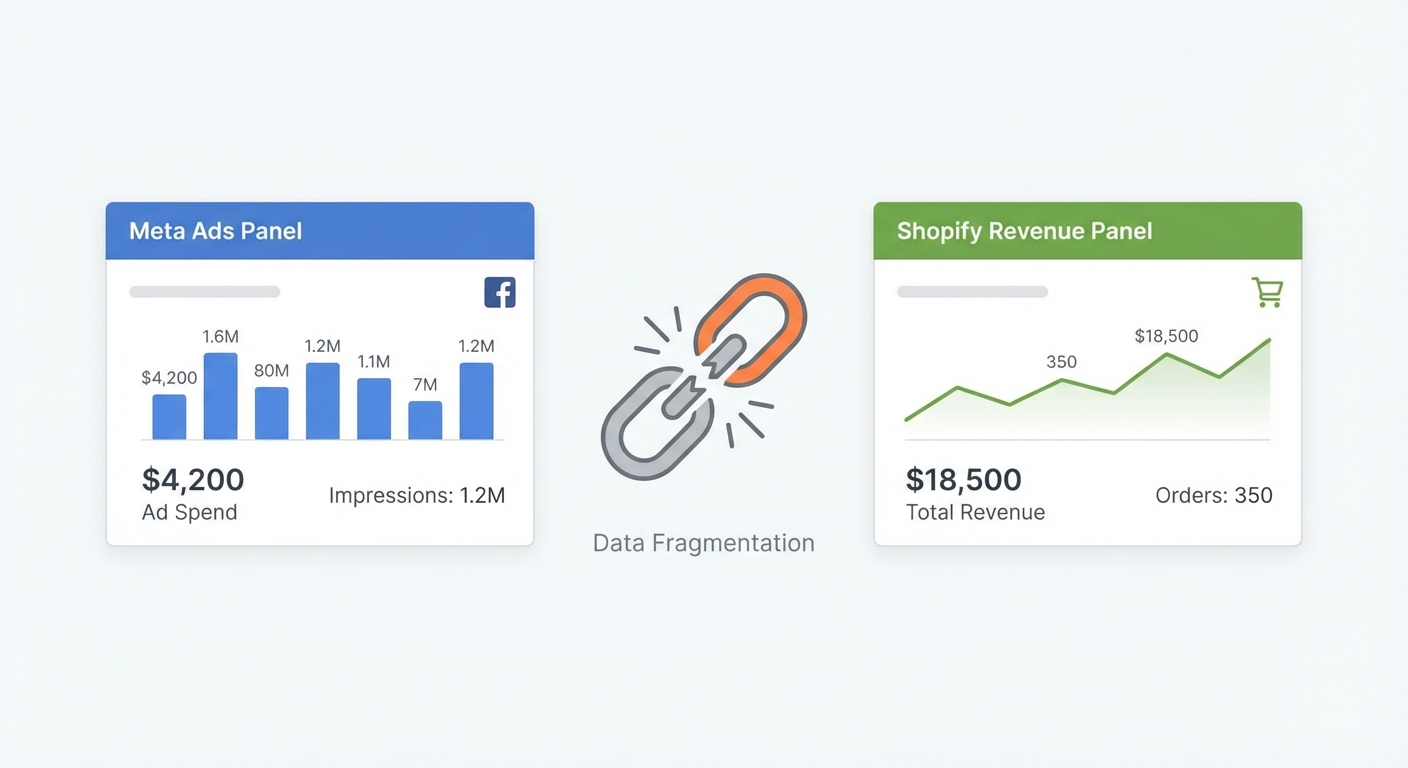
- Meta Ads Manager shows you daily spend and link clicks
- Google Ads shows you impressions and CTR
- Shopify shows you orders and revenue
- Your accounting app (maybe) has COGS and fees
- Your spreadsheet might have shipping costs you entered last month
None of these talk to each other.
[IMAGE PLACEHOLDER: Screenshot showing Meta Ads Manager on one tab, Shopify analytics on another]
So when you want to know: "Did my $500 Google Shopping campaign make money this week?"—you can't just look at one dashboard. You have to manually collect data from four places, cross-reference orders, estimate shipping costs, subtract fees, and hope your math is right.
By Thursday, you're still looking at Monday's data.
And here's the dangerous part: without that single view, you're flying blind on profitability. You might be scaling an ad campaign that looks great (high click-through rate, nice conversion rate) but is actually eating your margins because you're not seeing the full profit picture.
Why This Disconnect Is Dangerous
Let's say your Meta campaign generated $2,000 in revenue last week. That looks good.
But if you're selling lower-margin products (think home decor, wellness, or fashion), your actual profit might only be $300 after:
- Product COGS: $800
- Shopify fees: $60
- Payment processing: $80
- Shipping & packaging: $200
- Ad spend: $500
- Net profit: $360
Except you don't see the ad spend in that same view as your revenue. So in Shopify, it looks like you made $2,000. You feel great. You scale spend. And then your accountant tells you in three months that you're operating at 18% margin instead of your target 35%.
That's a $6,000 problem that a $200/month analytics tool would've caught in week one.
The Manual Approach: Build Your Own Weekly Tracker
If you're not ready to automate yet, you can absolutely build a spreadsheet that combines ad spend and profit. It takes about an hour to set up, and 10–15 minutes per week to maintain.
Here's the exact structure we recommend:
Weekly Ad Spend + Profit Tracker Template
| Date | Channel | Ad Spend | Orders | Revenue | COGS | Shopify Fees | Payment Processing | Shipping | Total Costs | Profit | ROAS | Profit ROAS |
|---|---|---|---|---|---|---|---|---|---|---|---|---|
| 2026-05-26 | Meta | $350 | 8 | $1,200 | $480 | $36 | $36 | $80 | $632 | $568 | 3.4x | 1.6x |
| 2026-05-26 | $200 | 5 | $950 | $380 | $29 | $29 | $60 | $498 | $452 | 4.8x | 2.3x | |
| 2026-06-02 | Meta | $420 | 9 | $1,420 | $568 | $43 | $43 | $90 | $744 | $676 | 3.4x | 1.6x |
| 2026-06-02 | $180 | 4 | $800 | $320 | $24 | $24 | $50 | $418 | $382 | 4.4x | 2.1x |
Here's what each column means:
- Date: When the week ended (Sunday)
- Channel: Meta, Google, TikTok, Pinterest, etc.
- Ad Spend: Total spend from the ad platform
- Orders: Count of orders attributed to the channel (or all orders for the week, if you're using UTM parameters)
- Revenue: Total order value
- COGS: Cost of goods sold. Use your average per order, or get exact by pulling order line items
- Shopify Fees: 2–3% depending on plan
- Payment Processing: ~2.9% + 30¢ for Stripe; check your processor
- Shipping: Actual or average
- Total Costs: Sum of COGS, Shopify Fees, Payment Processing, Shipping
- Profit: Revenue – Total Costs – Ad Spend
- ROAS: Revenue ÷ Ad Spend (Return On Ad Spend)
- Profit ROAS: Profit ÷ Ad Spend (the number that actually matters)
Worked Example: A Real Store
Let's say you sell handmade candles. Your product COGS is about 40% of selling price. You're running both Meta and Google Ads.
Week of May 26, 2026:
| Metric | Meta | Combined | |
|---|---|---|---|
| Ad Spend | $350 | $200 | $550 |
| Orders | 8 | 5 | 13 |
| Revenue | $1,200 | $950 | $2,150 |
| COGS (40%) | $480 | $380 | $860 |
| Fees & Processing | $72 | $53 | $125 |
| Shipping (avg $10) | $80 | $50 | $130 |
| Total Costs | $632 | $483 | $1,115 |
| Profit Before Ads | $568 | $467 | $1,035 |
| Profit After Ads | $218 | $267 | $485 |
| ROAS | 3.4x | 4.8x | 3.9x |
| Profit ROAS | 0.6x | 1.3x | 0.9x |
What do we learn here?
- Meta looks good on ROAS (3.4x) but is barely profitable after accounting for ad spend. You're making $0.62 per dollar spent.
- Google is actually crushing it at 1.3x profit ROAS. You're making $1.30 per dollar spent.
- Combined, you're profitable, but only if you cut or optimize the Meta campaign.
Without this view, you might've scaled Meta spend because the 3.4x ROAS sounds strong. That's the trap.
Track this automatically
Shopimize shows your real profit per order, per product, per channel.
Try Shopimize free →The Limits of Manual Tracking
Okay, so you can build this. But here's what breaks:
Delayed data
You'll always be looking at last week's numbers. By the time you see that Meta campaign isn't profitable, you've already spent another $350 on it.
Human error
Spreadsheets are error-prone. You'll forget to update COGS, miss a payment processing fee, or pull the wrong figure from Shopify. One wrong number ruins the whole picture.
No product-level insight
You know that Meta is profitable overall, but which products are actually driving the profit? Your spreadsheet can't tell you. You'd need a separate tab for each product, and then you're managing five spreadsheets.
No campaign-level breakdown
You're tracking Meta as one bucket. But you've got a "Retargeting" campaign and a "Cold Traffic" campaign running simultaneously. Which one is profitable? The spreadsheet doesn't know.
No attribution logic
You're attributing orders to a channel based on what? Last-click attribution? UTM parameters? What about orders that came from multiple touchpoints? The spreadsheet doesn't handle that well.
The Automated Approach: How Modern Tools Work
A proper ad spend + profit tracking tool does three things:
1. It connects to your ad platforms via API
Meta, Google, TikTok, Pinterest—they all have APIs. A good tool pulls spend data directly every few hours, so you're never looking at stale numbers. No manual export. No copy-paste. Data is live.
2. It connects to Shopify and pulls order-level data
Every order. Every product. Every payment. Every shipping cost. The tool automatically calculates COGS per order (using your variant-level cost data), Shopify fees, payment processing fees, and shipping.
3. It attributes profit to each ad platform
This is the critical part. The tool asks: "Which orders came from Meta? Which came from Google?" and calculates profit per channel.
The attribution question is the one we need to talk about, because this is where most tools get it wrong.
The Attribution Question: Total Spend vs. Attributed Spend
Here's the problem with most ad analytics tools:
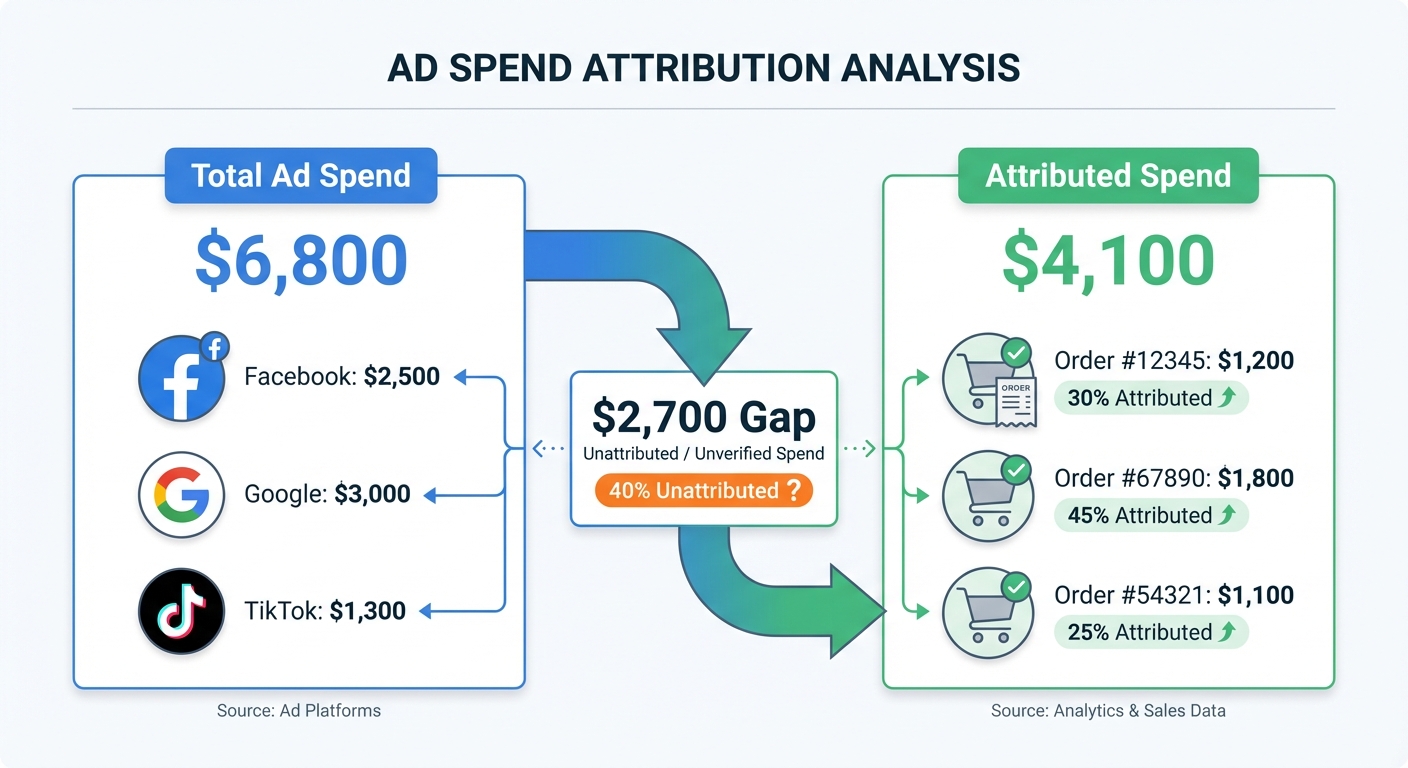
They only count attributed revenue—meaning orders where they can find a UTM parameter or a click event that matches a campaign.
So if your Meta campaign spent $500, but only $3,200 of your $5,000 weekly revenue has a Meta UTM attached, the tool calculates profit on just that $3,200.
But here's the thing: you still spent the full $500. That $1,800 of revenue with no UTM might've been influenced by your ads. A customer saw your ad on Tuesday, didn't click, then came back via direct on Friday and bought.
If you only count attributed spend, you're underestimating your customer acquisition cost and overestimating your profitability.
The more honest approach—and the one Shopimize uses—is to use total platform spend divided by all revenue for the period. You spent $500 on Meta. You made $5,000 in revenue. Therefore, your blended Meta ad spend on every dollar is $0.10.
Is that less precise than UTM-perfect attribution? Yes. Is it more accurate? Also yes. Because it accounts for the full customer journey, not just the clicks you can track.
Your Minimum Viable Dashboard
You don't need a complex dashboard. You need five metrics, checked daily:
- Total Ad Spend (This Week) — All channels combined. Check how much you've burned.
- Total Profit (This Week) — Revenue minus all costs, minus all ad spend. This is the only number that actually matters.
- Blended CPA — Total Ad Spend ÷ Total Orders. What are you paying per customer, across all channels?
- Break-Even CPA — (Total Costs per Order) ÷ 1. At what customer acquisition cost do you stop making money?
- Profit After Ad Spend — The absolute dollar amount left after you've paid for ads. Make it a big number at the top of your dashboard.
If Profit After Ad Spend > 0 and Blended CPA < Break-Even CPA, you're in the green. Scale or hold. If you're in the red, cut spend or optimize until you're not.
[IMAGE PLACEHOLDER: Clean dashboard mockup showing these five metrics in card layout]
How to Set Up Automated Ad Spend + Profit Tracking
If you're ready to move beyond the spreadsheet, here's what to look for in a tool:
- Direct API connections to Meta, Google, TikTok — No manual exports
- Automatic COGS calculation — Based on your Shopify product cost data
- Profit per channel — Not just revenue per channel, but net profit
- Order-level attribution — You should be able to click on any order and see which ad platform brought it
- Daily data — Not weekly summaries. You need to know what happened yesterday
- Breakdown by product and campaign — Not just channel-level, but granular enough to optimize
- Profit ROAS or similar metric — A number that shows profit per dollar spent, not just revenue
The tool should connect to Shopify, pull your cost data, connect to your ad platforms, and do the math for you. If you're doing math in a spreadsheet, you're not truly automated.
FAQ
How do I know which ad platform is most profitable?
Compare the Profit ROAS for each channel. If Meta is 0.8x and Google is 1.2x, Google is returning more profit per dollar spent. That doesn't mean cut Meta—it means optimize Meta or reallocate some budget to Google. The profitability ranking is your guide for scaling.
What if I'm selling on multiple sales channels (Shopify + Facebook Shop + TikTok Shop)?
Your tracking should be Shopify-centric. All orders end up in Shopify eventually (or they should, for accounting purposes). Track ad spend by platform, and track profit by order—regardless of where the order was fulfilled. This gives you an apples-to-apples view.
How do I handle orders with no clear ad attribution?
Most tools use a blended approach: they divide total ad spend across all orders for the period, weighted by the number of attributed orders. So if 60% of your revenue has a Meta UTM, 40% is unattributed, you're splitting the ad spend proportionally. This isn't perfect, but it's more honest than pretending the unattributed orders have zero ad influence.
Should I track ROAS or Profit ROAS?
Both. ROAS tells you about top-line efficiency. Profit ROAS tells you if you're actually making money. A campaign with 4x ROAS but negative Profit ROAS is a trap. Always optimize for Profit ROAS.
How often should I check my ad spend + profit numbers?
Daily, if possible. Weekly at minimum. Set a calendar reminder every Monday morning to pull the previous week's numbers and compare to your break-even CPA. This keeps you from scaling an unprofitable campaign for six weeks straight.
What if my profit keeps changing day-to-day? Can I trust the numbers?
Yes. Profit moves because orders have variable shipping costs, COGS varies by product, and refunds happen. A good tool recalculates every time new order data comes in. You should see the "live" number refreshing as Shopify pushes new data. This is normal and means the tool is working correctly.
Can I track ad spend by individual campaign?
Yes, most tools allow this. You should be able to drill down and see: "My Meta Valentine's Day Campaign spent $800 and generated $2,400 in revenue and $320 in profit." Campaign-level tracking is how you actually optimize. Don't settle for channel-level only.
How do I factor in indirect costs like staff time, software subscriptions, or warehouse rent?
That's a bigger accounting question. For the purposes of ad spend profitability, focus on variable costs per order: COGS, payment fees, shipping. Those move with each order. Fixed costs (rent, salaries) are real but don't change based on ad spend, so they're better handled in a separate P&L. Ad spend + Profit tracking shows contribution margin, not net profit. Both numbers matter, but they're different.
The Bottom Line
You can't optimize what you can't measure. And you can't measure ad profitability if your ad spend data and profit data live in different worlds.
Start with a spreadsheet if you need to. It'll take you maybe 15 minutes per week and you'll have clarity you didn't have before. But don't stay there. Manual tracking is slow, error-prone, and keeps you from moving fast enough to capitalize on what's working.
The real win comes when you can check one dashboard every morning and know: "This week, after paying for ads, I made $X in profit. These are my five most profitable channels. This campaign is below break-even. Here's where I should cut or scale."
That clarity—that's worth the time to set up automated tracking.
Want your ad spend and profit in one dashboard — updated automatically? Try Shopimize free and connect your ad accounts in under two minutes.